Relation visualization
Basics
The CURSOR relation visualization visualizes the relationships between people and companies in the CRM system in a mesh-like graph structure. The visualization can be adjusted to the contact intensity between two people to determine those, who are most frequently in contact.
Configuration
You need administration rights to adjust the CURSOR relation visualization.
Application settings
The visualization needs only a few parameters to work. These parameters are entered in the CRM system. Open the Admin Console via the item Administration in the menu bar. Select the Global Variables menu item on the left. Create the following variables if they were not yet created for similar components:
Variable name | Field type | Data type | Value |
|---|---|---|---|
RelationGraph_MinRelationActivities | Number | At least “0” | |
RelationGraph_MaxRelationActivities | Number | At least MinRelationActivities. Example value: 100 |
It may be necessary to maintain the following global variables in order to store the path to the server. This is the case if an error message is displayed instead of the relation graph and this refers to a URL that does not match the server URL.
Variable name | Field type | Data type | Value |
|---|---|---|---|
C0CursorDefaultServerProtocol (up to 19.2 cursor.default.server.protocol) | Text | Protocol for application server (generally "https") | |
C0CursorDefaultServerBaseURL (up to 19.2 cursor.default.server.baseURL) | Text | Basic URL of the application server (e.g. crm.mycompany.com) | |
C0CursorDefaultServerPort (up to 19.2 cursor.default.server.port) | Text | Port of the application server (e.g. 18443) |
Search
The component needs searches to be able to determine relations. These searches can be modified according to your own criteria. For example, the visualization could be limited to the visualize phone calls only.
Search name | Searches for... |
|---|---|
IB_RelationGraph_ContactPerson | ...contact person for the company or business partner role for the focused node |
IB_RelationGraph_ContactPerson_related_to_Employee | ...contact person with contact to the employee for the currently focused node |
IB_RelationGraph_ContactPersons_of_Employee_ActivityCount | ...contact person with contact to the employee for the currently focused node and the number of activities between the two |
IB_RelationGraph_Customer_of_ContactPerson | ...company or business partner role for the contact person for the focused node |
IB_RelationGraph_Employee_related_to_ContactPerson | ...independent employee with contact to the contact person for the currently focused node |
IB_RelationGraph_Employee_related_to_ContactPerson_ActivityCount | ...employee with contact to the contact person for the currently focused node and the number of activities between the two |
IB_RelationGraph_RootContactPerson | ...first root node for start from contact person |
IB_RelationGraph_RootCustomer | ...first root node for start from business partner |
IB_RelationGraph_RootEmployee | ...first root node for start from employee |
IB_Organigram_Employees | ...company employees |
IB_Organigram_Chefs_by_ContactPerson | ...boss from the company, assuming a company employee (contact person) |
IB_Organigram_Chefs | ...boss from the company, assuming the company |
IB_Organigram_Enterprise | ...company from a contact person |
IB_CompanyStructure_Subsidiaries | ...subordinate company from a corporation |
IB_CompanyStructure_MasterOfCompanyKey | ...corporation from a company short name |
IB_CompanyStructure_MasterOfCompany | ...corporation from a company according to Pk |
IB_CompanyStructure_CompanyOfPk | ...company for a Pk |
Application
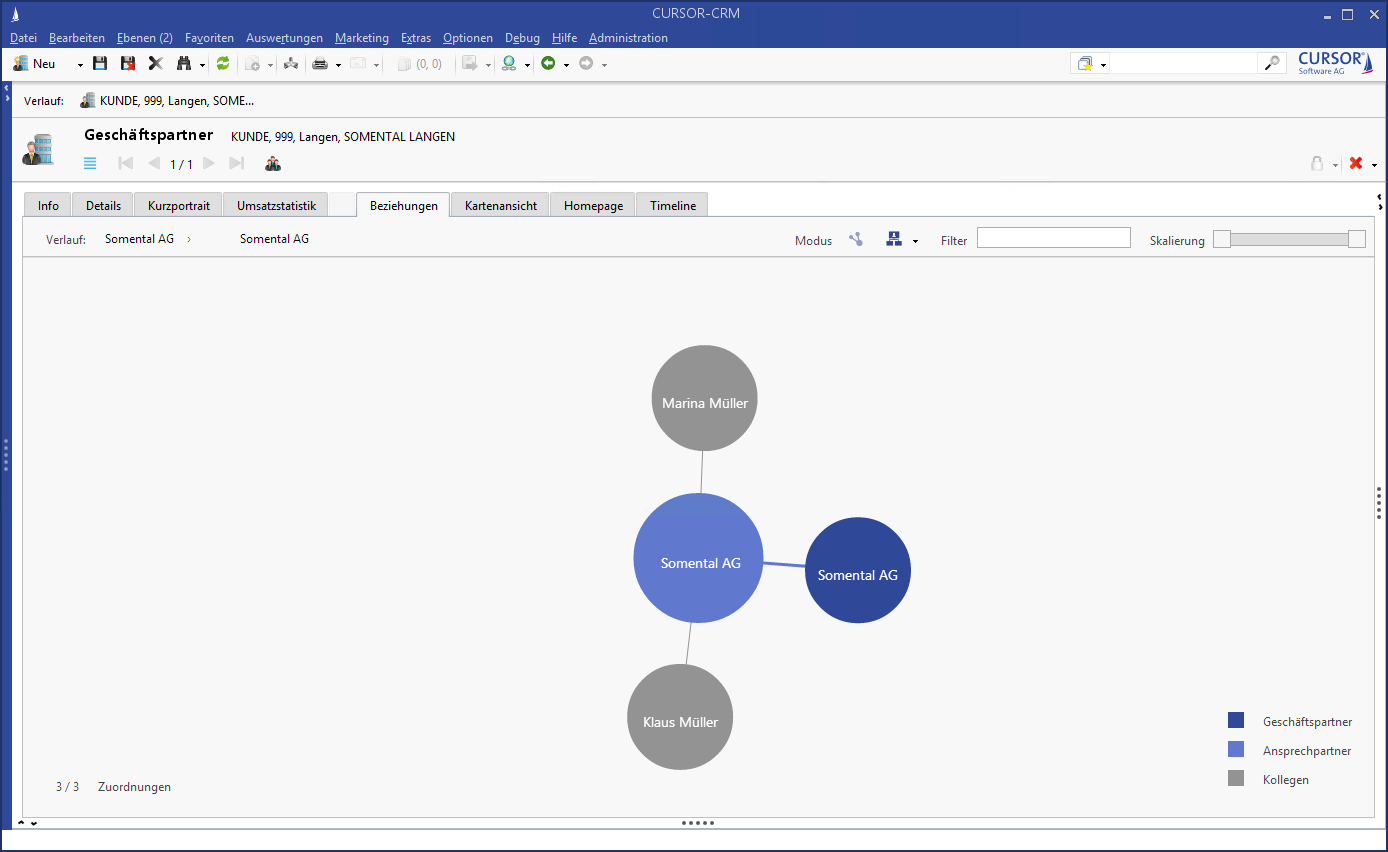
The relationship visualization displays the currently observed node, the original node (if you navigated away from it) and the data linked to the focused node, depending on your current viewpoint or entry point (business partner, contact person, employee). All other navigation in the graph system is done via the context menu of the individual nodes.
The various entities are differentiated in 3 colors:
Color | Entity |
|---|---|
 | Business partner |
 | Contact person |
 | Employee |

Figure: Relationship visualization in the business partner
Two simple operating elements allow you to work with the visualization:
The context menu of the nodes
The filter area
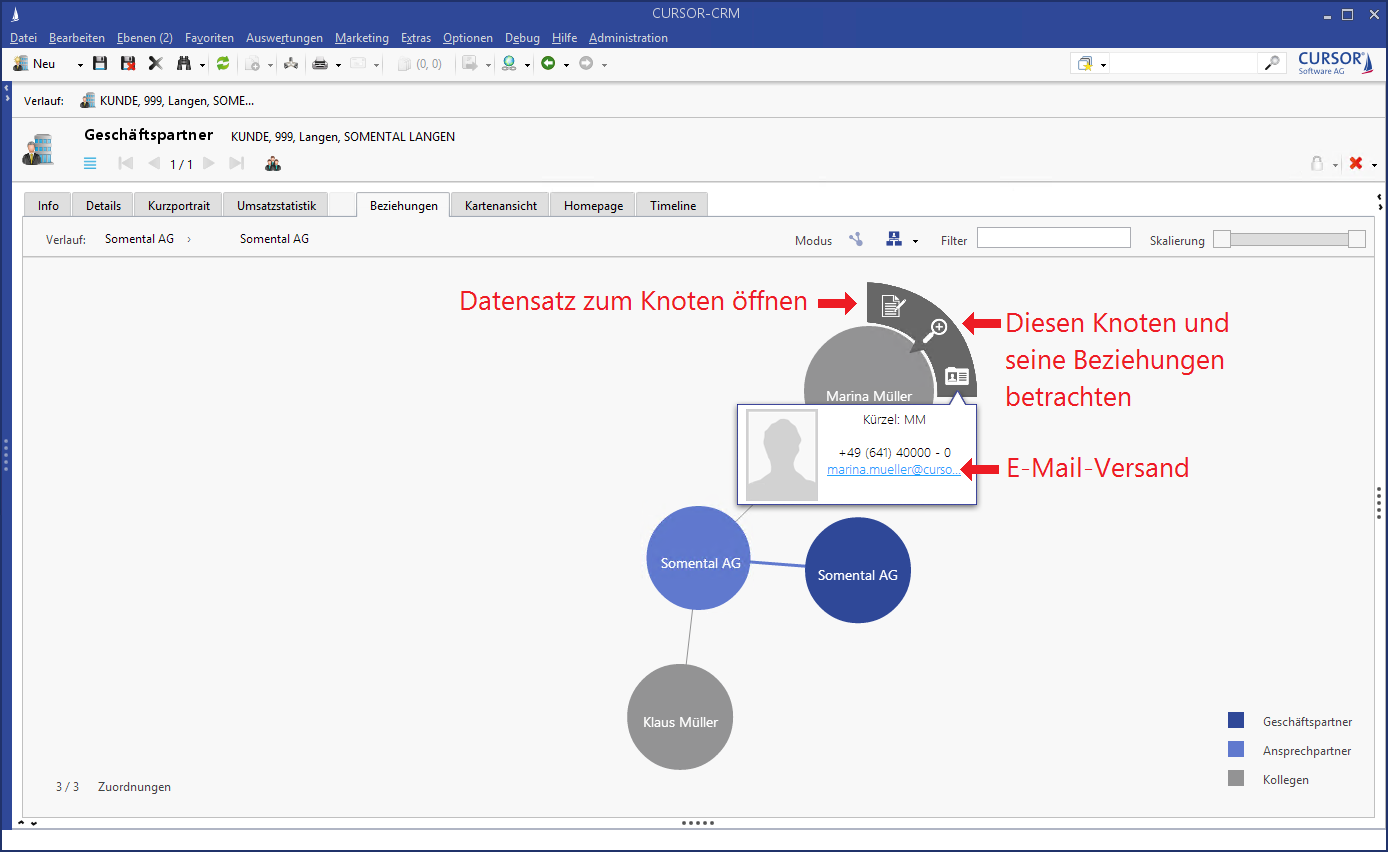
The context menu appears automatically when the mouse is moved over a node. The context menu is fixed by clicking a node.

Figure: Context menu of a node in the graph of the relation visualization
The following functions are available:
Open dataset of the node
The dataset of the node opens in a new level. The visualization graph remains as you left it. You can continue navigating the graph in the same spot, once the dataset level is closed.
Observe/focus node
The selected node becomes the center of the graph and any applicable relationship nodes are displayed.
Show short info
A business card with brief information such as the business partner address is displayed for the node. If an email address is saved, the standard email application can be started from within the graph.

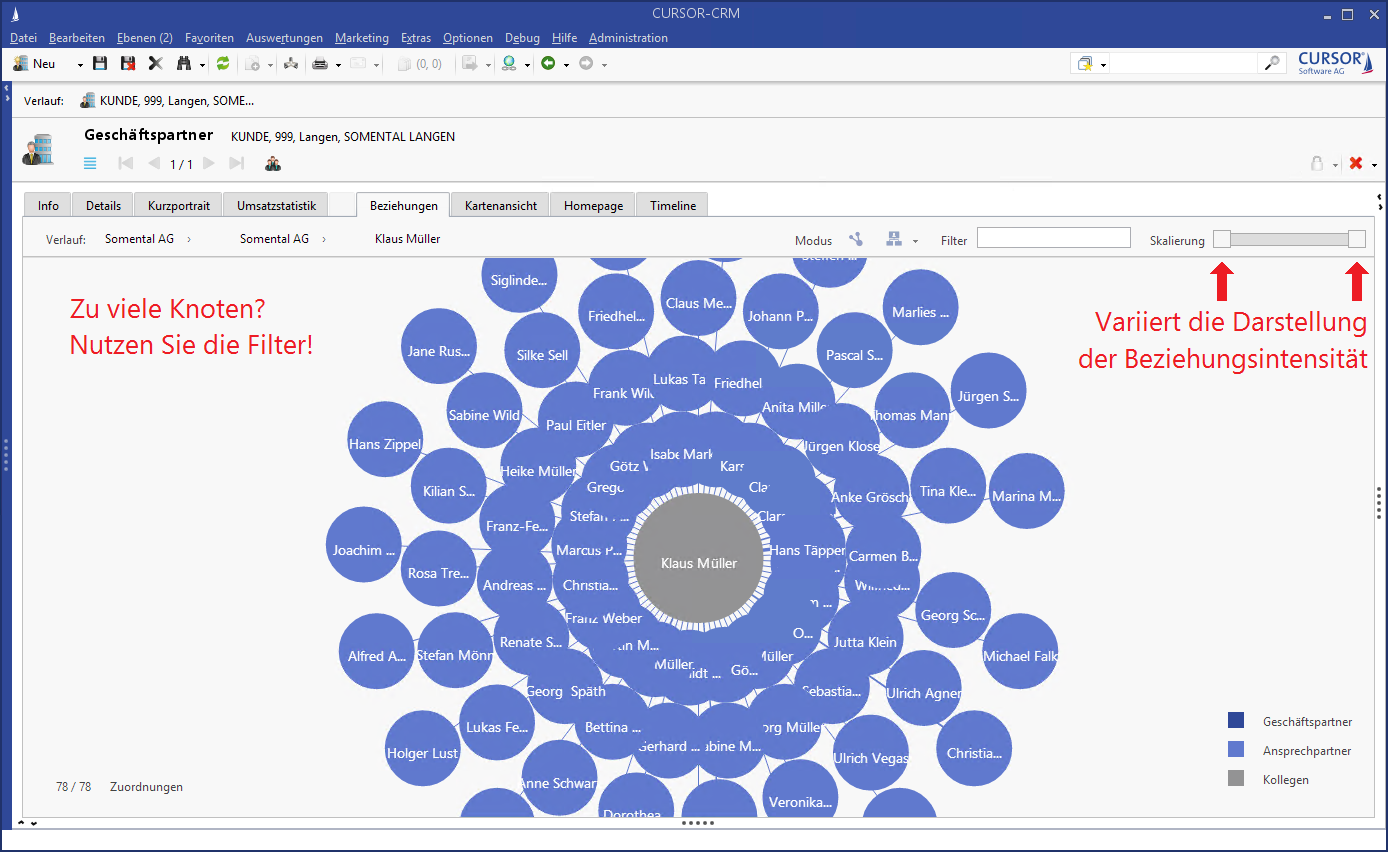
Figure: Filter range to limit excessively large data quantities in the relationship graph
The filter range consists of a text input field and a double-sided slider. Use the text input field (Filter) to filter for name components. Only those nodes containing this specific letter string in the name will be displayed. You can also use a prefix to filter for other information. Available are:
ZIP Code
City
Street
Phone
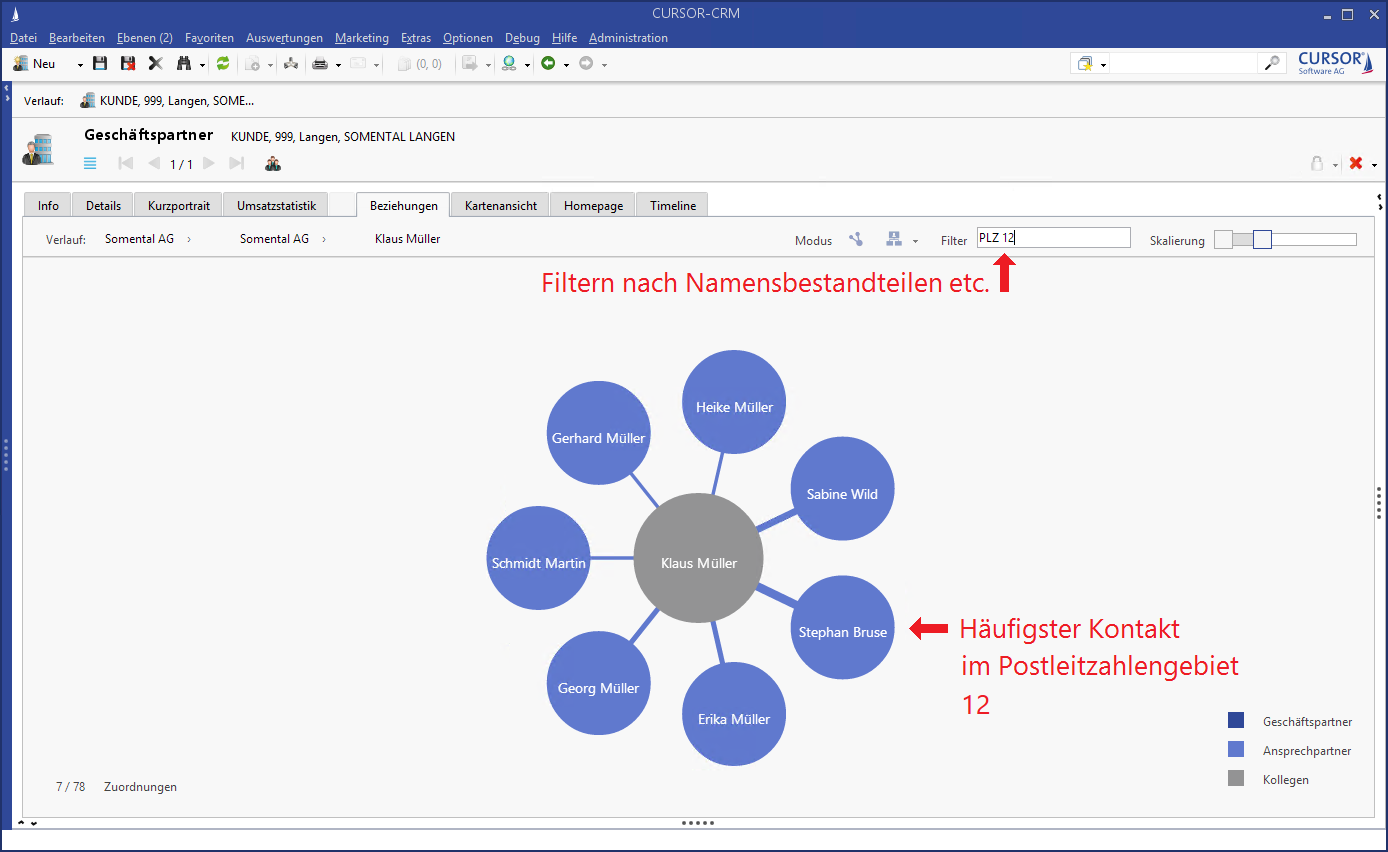
Example: The input text “ZIP 353” only shows the nodes that are in the 353 zip code range.
Use the slider (scaling) to control the display of the edges (the connection lines between mother and daughter nodes) and the number of relevant nodes. The left slider allows the removal of successive nodes from the graph that show low contact intensity with the mother node. At the base of this action is a minimum number of actions based on contact intensity that can be increased with the slider. The right slider changes the relative line thickness of the nodes. This will allow a fine tuning to emphasize the nodes with the highest contact intensity. When used together, the sliders allow a scaling and focusing on the data in the search.
The visualization of the links between business and contact partners (both node types are blue) cannot be changed, as no criterion regarding the relationship intensity between the company and its employees/contact persons was specified.

Figure: Visualization of filtered relationship data
