Monitor overview
The monitor provides reports you can use for efficient strategic process management. The "Instances" area below the process areas is provided for the operative process management.
Report content
Reports offer insights into time and volume KPIs, as well as completion states.
Time KPIs are:
-
Min., average and max. runtime (TT): Total time from instance start to instance end.
-
Min., average and max. processing time (PT): Time for the execution of scrip and user tasks.
-
Min., average and max. wait time (RT): Time for the user tasks, during which an instance was assigned to a user pool and was waiting for an assignment to a specific employee.
The number of the executed instances is the volume KPI.
The following completion states are evaluated:
-
In progress
-
Waiting
-
Error
-
Completed
-
Canceled
-
Deleted
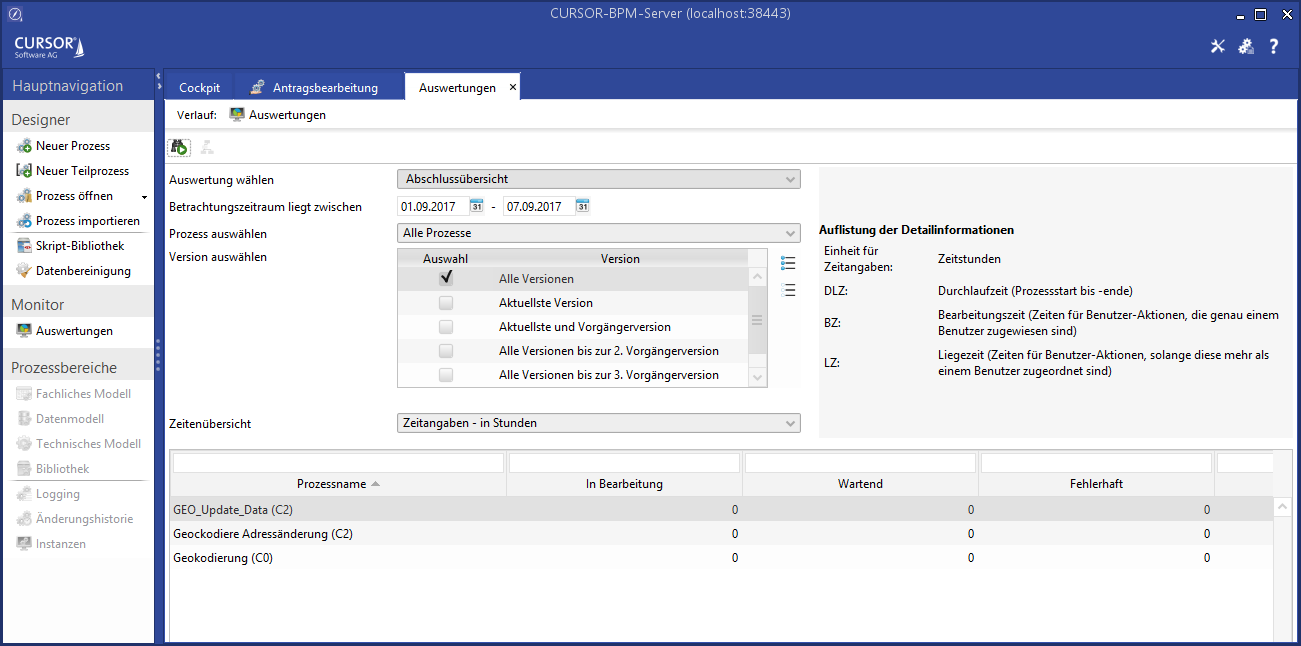
You can use the following report types:
-
Time overview - all processes (by version):
Display of all processes and how many instances per process version were executed and their time KPIs. -
Time overview - Single process (by version)
Just like the previous report, but for the process you have selected. -
Time overview - Single process (by instances)
Display for the individual instances of the process: Version, start/end time, status, runtime, processing time, wait time, instance information of the end event. -
Summary view
Displays for all processes, how many instances exist with the relevant completion states..
Operation
Enter your search criteria at the top:
-
Which report do you want?
-
For which reporting time range?
-
For which process, provided the report requires a process selection?
-
For which process versions?
Start the report by clicking the icon
![]()
The result data will be displayed in the bottom area of the mask. You will still be able to see your criteria at the top. Clicking the navigation item Reports will open a new tab, which means you can have multiple reports open at the same time. You can select the result data just like in CRM. Right-click to open the context menu, which will allow you to copy the selected datasets to Excel.
Graph analysis
The instances can be visualized in a graph by clicking ![]()
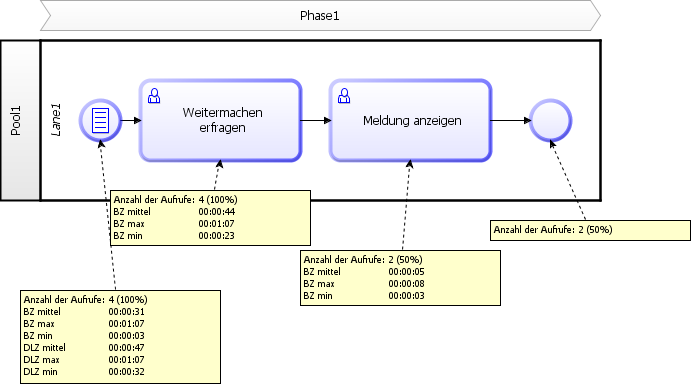
Legend:
-
RT avg - average process runtime
-
RT min - min. process runtime
-
RT max - max. process runtime
-
RT sd - standard deviation
-
UPT avg - average processing time for user tasks
-
UPT min - min. processing time for user tasks
-
UPT max - max. processing time for user tasks
-
WT avg - average wait time for tasks in a group
-
WT min - min. wait time for tasks in a group
-
WT max - max. wait time for tasks in a group