Basics
![]()
The relations between business partners, contact persons and employees (colleagues) can be displayed with a graphics. By clicking the icon
![]()
at a business partner, contact person or employee you can open the relation graph between these persons.
You have the option to switch between the views Relations, Organization chart and Corporate group, depending on the entity of the currently focussed dataset. In the corner to the lower right of the graph screen you can read the color assignments of the entities in a legend. With navigation between the nodes and the views though CRM you can navigate over different ways.
Relations
The relations can be displayed for all entities. The "relation intensity" is represented with the thickness of the connection line. In standard the relation intensity is determined over the number of activities between these persons (except for relations between business partners and relating contact persons). When you move your mouse over the node of the graph resp. touch it on a respective unit, the context menu of the node appears. There you can open the dataset over the edit symbol in a new level in the CRM-system, over the business card symbol a preview of the datasetapperas. With the magnifier symbol you can focus the dataset, e.g.it moves to the center of the screen and its linked nodes appear. Imagine the graph being a multiple-linked net of datasets and the graph being its cut-out section, only showing the focussed dataset and its direct relations.
For many relations you have the possibility to filter. To do so, choose the Filter field, enter a filter name, so that the name of the person / company is filtered for, or click SPACE BAR , to have a list of criteria displayed you can filter accordingly. Select a criteria and complete these with the corresponding filter name.
You can adapt the number of displayed nodes and the area of the connection line intensity so that the graph shows a result easy to read for you. To do so, draw both scaling scroll bars closer (or further apart) until you get the desired view. The scroll bars automatically adapt plausible example values while focusing a dataset. The left scroll bar limits the nodes to a minimum number of activities resp. to a minimum relation intensity and masks all relations with too little intensity. The right node adapts the quotient to the relation intensity calculation which is determined by the minimum number of activities needed for the strongest intensity. For relations between business partners and contact persons the scoll bars cannot be used as simply all (filtered) contact persons are shown in a flat hierarchy.
In progress you can only navigate in this view.
Organization chart
The organization chart can only be used for business partner and employee nodes. It shows the hierarchy of the employees (actually contact persons) of a company, if administered in the corresponding datasets over the field Superior. Datasets without superior are displayed at the very top of the hierarchy.
Here no context menu is displayed. In order to focus nodes simply click on them. Now change the view and the node is shown in the respective view.
Corporate group
The corporate group structure can only be used for business partner nodes and only works when you have maintained the corporate group structure in the business partner over the field Corporate group.
Here no context menu is displayed. In order to focus nodes simply click on them.
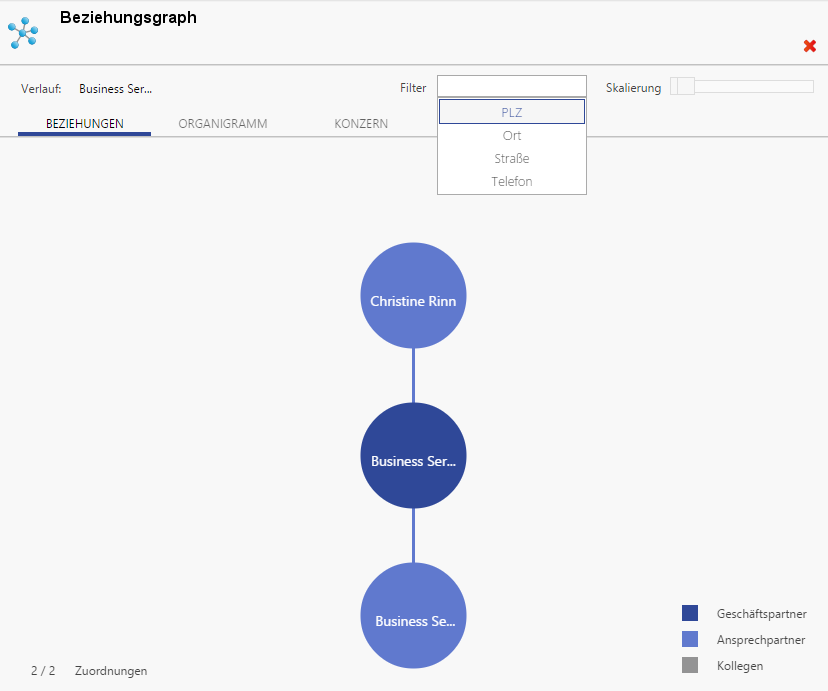
Figure: Relation Graph