General information about JasperReports
Jasper was created in 2001 as an add-on module to another application and was then released as open source software. The growing popularity of the product led to the founding of JasperSoft in 2005. JasperSoft now offers a full-featured business intelligence suite and, in addition to free software, also sells commercial versions and services. The English word "Jasper" denotes the semi-precious stone jasper.
JasperReports is an open source Java report library that can be integrated into any Java project (making it particularly suitable for integration into CURSOR-CRM ). It allows you to export reports as HTML, PDF, Flash (SWF), Excel (XLS), CSV, Word (RTF), TXT and XML and display them on the screen or print them. The 'Jasperviewer' is available for a preview function.
JasperReports was designed for developers and power users. The API allows the creation, manipulation and execution of report designs. The report engine is integrated on the application server, which facilitates and speeds up access to reporting data.
Overview of JasperReports advantages:
-
Very good performance
-
Free (except the manuals)
-
Design templates in commonly used XML standard
-
Additionally contains complete Java API
-
Also supports internationalization
-
Nested subreports can be used in principle
The iReport design program allows you to create draft reports with pixel-precise positioning of all report elements, as well as complex reports with multiple components using subreports.
In this documentation, the 'iReport' designer is also called "JasperReports" or "Jasper" for the sake of simplification.
Draft report and report
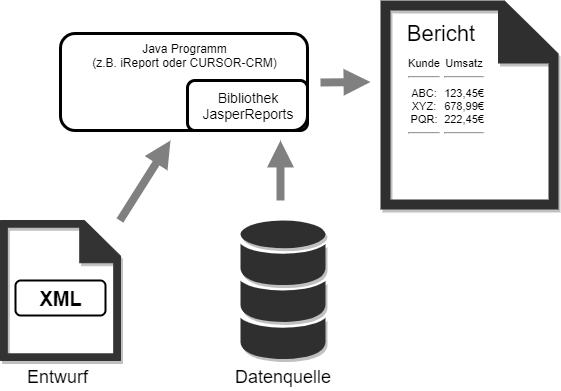
A draft report is a template that describes how data is to be printed on paper but does not contain any data itself. It contains placeholders, formatting and other elements.
In addition to the draft, you always need a query that retrieves data from a database. In CURSOR-CRM/EVI, this is the search container.
The finished report is then derived from the draft and the data. The following figure illustrates the interaction between the components:
A Jasper draft report is an XML file and can therefore also be created and edited by other programs. This is exactly what happens in CURSOR-CRM when you start a new draft report (see chapter: Start a new report)
This is the smallest valid draft report:
<?xml version="1.0"?>
<!DOCTYPE jasperReport PUBLIC "-//JasperReports//DTD JasperReport//EN"
"http://jasperreports.sourceforge.net/dtds/jasperreport.dtd">
<jasperReport name="a ">
</jasperReport>
In 'iReport' it is displayed like this:
The iReport user interface
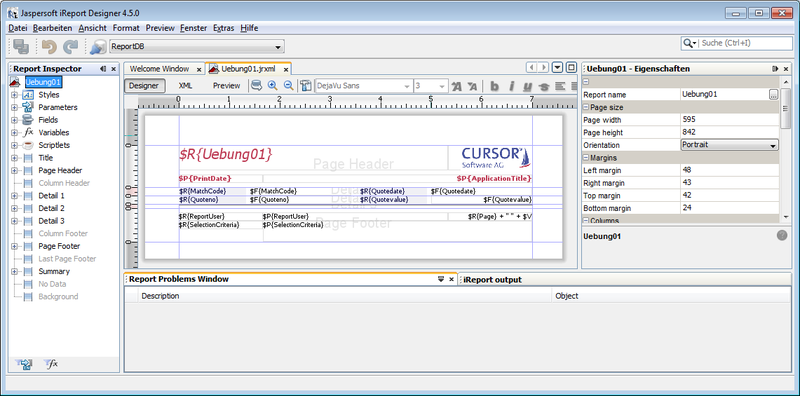
The iReport designer displays a draft report surrounded by windows that contain tools or insertable elements.
The windows you will use most often are:
-
Document Inspector (left): here you can access all fields, sections, variables, areas and other components of the report, as well as the report itself. For example, once you select an element, you can see all its properties on the right side of the Properties window. For fields, once you select a field in the draft, it is also selected in the Document Inspector and vice versa.
-
Properties (right): here you can find the size and font of a field, but also report-wide properties such as portrait/landscape format.
-
Palette (can be activated via the "Window" menu): here you will find objects that you can insert into the report: text fields, graphics, etc.
-
Formatting Tools (can be activated via the "Window" menu): here you will find numerous buttons with which you can arrange several fields flush with each other or make them the same size.
-
Additional windows can be added as required.
The draft report consists of horizontal sections.
When the report is executed, these are output at different intervals and at different positions. For example, "pageFooter" is printed at the bottom of each page, "detail" is printed for each dataset.
The representation in the draft therefore only approximates the function of the sections. For example, "summary" is shown below "pageFooter" in the draft.
Comparison with Crystal Reports
If you have already worked with Crystal Reports, you will quickly find your way around Jasper. The following table is intended primarily as a guide to facilitate the transition.
|
Property |
Crystal |
Jasper |
|---|---|---|
|
Data |
{TABELLE.Feld} |
$F{Feldname} |
|
Parameter |
{?Name} |
$P{Name} |
|
Expressions |
Named, reusable |
Anonymous |
|
Field object |
Represents a data field or formula field |
Contains anonymous expression |
|
Sorting |
By any expressions |
By data fields |
|
Grouping |
As desired even by expression |
Same, but pre-sorting required |
|
Filtering by expression |
Yes, data set selection formula |
Yes, filter expression |
|
User input |
Parameter field |
Also available, but in CURSOR-CRM via CURSOR-CRM search instead |
|
Total, average, ... |
Variable |
|
|
Running total |
Running total |
Variable |
|
Formatting |
Only field by field |
Field by field and via styles |
|
Totals of totals |
Not possible |
Possible |
iReport without CURSOR-CRM
CURSOR Software AG does not support the use of Jasper outside of CURSOR-CRM/EVI.
You can use the 'iReport' report designer as a reporting tool for any database without any reference to CURSOR-CRM. To report from a database, you need to create a suitable data source in iReport. This is done in the Data / Connections / Data Sources menu item. Often a database is already accessible via ODBC. Here is an example of an iReport data source based on an ODBC data source. The name of the ODBC data source is XYZ. It is recommended to name the iReport data source as well. It should therefore be set as follows:
Name: XYZ; driver name: sun.jdbc.odbc.JdbcOdbcDriver; URL: jdbc:odbc:XYZ
The first step in creating a new report is to formulate the query in SQL (Data / Report inquiry menu item). The query can contain any number of tables and sub-queries; anything you can do in SQL with SELECT. The response table is then evaluated with Jasper tools.
Output of field contents and field labels
The menu item View / Report fields opens the list of available fields. From there, you can drag the field into the draft report. Then set the appropriate style. It is often easier to copy an existing text field and modify its expression so that it names the desired data field.
Special features when passing certain fields to Jasper
You will notice the following with some fields: You include a single field in the search, but several fields arrive in Jasper.
This is intended to simplify access to additional information.
For key fields (example: occasion of an activity) you always receive three fields and three identifiers on the Jasper side. These are usually used:
-
$F{Fieldname_KeyName} = KEY
-
$F{Fieldname_KeyDesc} = Long text
-
$R{Fieldname_Pk} = Field label (see the chapter on label texts)
For some other fields, CURSOR-CRM transfers additional related fields. For example, in addition to an employee token, the last name, first name, telephone and some other fields are transferred to the report.
These additional fields are defined in CURSOR-CRM cannot be changed.
Again, $R{fieldname_Pk} gives the field label.
Problems with rich text fields
In the past, sometimes a report started, but the execution did not finish and the designer or application server ran out of memory. This was observed in the 'Weekly Report'. This delivered about 1300 pages for about 1100 activities in one week.
The following settings had to be changed in the report to ensure error-free execution:
-
Section properties
If, for example, the text field of the activity is displayed in the detail area of the report, the Divisible option must always be active. -
Overflow
If the activity text is too long for the page, it can break. But if it is too long for 2 pages, then another option called Print when details overflow comes into play. This option must be deactivated. -
Markup
New in JasperReport 3.0 is the Markup option. This replaces the Formatted Text option. It should be noted that neither HTML nor RTF are currently supported.
Calculations
Sometimes you have to generate additional values from the CURSOR-CRM /EVI raw data. There are two typical forms of calculation in reports:
-
Dataset related: for example, per dataset A-B if A and B are fields from CURSOR-CRM/EVI.
-
Across datasets: think of a column total at the end of a table.
The following table shows the two basic forms of calculation as examples:
|
ReferenceNo. |
A |
B |
A-B |
|---|---|---|---|
|
KD01 |
30 |
20 |
10 |
|
KD02 |
60 |
25 |
35 |
|
Total |
90 |
55 |
45 |
Both calculation forms take place in Jasper, not in CURSOR-CRM and not in the search.
Jasper uses Java expressions for both types of calculations.
This chapter deals with dataset-related calculations while the following chapter deals with totals.
Formula syntax
Similar to Excel, Jasper formulas are written into the rectangular fields. The formula syntax is the Groovy programming language. It resembles Java, but is both simpler and more powerful. The alternative formula language JavaScript is not provided for in the CRM and CURSOR does not provide support for this.
All possibilities of Java classes are available to you. For questions about formula syntax, you can therefore use general sources for Java or Groovy. Often a search engine query such as Java DateDiff provides the solution. Even more productive are requests in English, in the example java date difference.
Groovy allows you to extend Java classes and provides such extensions already. For example, it is possible to calculate time spans between date objects. See below for more information.
Elementary building blocks for your formulas are:
-
$F{fieldname}: the data fields from the CURSOR-CRM search; the available fields can be viewed with the Data/Report Query menu item.
-
$R{fieldname}: the associated labels; some other useful texts (for example "sum"), also freely definable, are also available as $R values.
-
$V{Name}: special internal report values, for example totals or the page number
-
$P{Name}: parameters from CURSOR-CRM
Usually a formula consists exclusively of such a $ value.
The most common data types are integer, double, Boolean, timestamp, string
If you are editing a report created with an earlier version of iReport or CRM, Java is still set as the formula syntax. You can easily switch this to Groovy. In the properties of the report you will find the 'Language' property - this is the formula syntax. Formulas in Java syntax also work under Groovy.
Inserting a calculated expression into the draft report
First you need a text field. Under Window/Palette you will find a help window that contains a text field icon, among other things. Click on this and then click in the report.
Right-click to open the expression editor (edit expression).
The expression editor
At all places where you see an expression, you will also find a button that opens the expression editor to help you write expressions. Another way to open the editor is the 'Edit expression' item in the context menu of each field object.
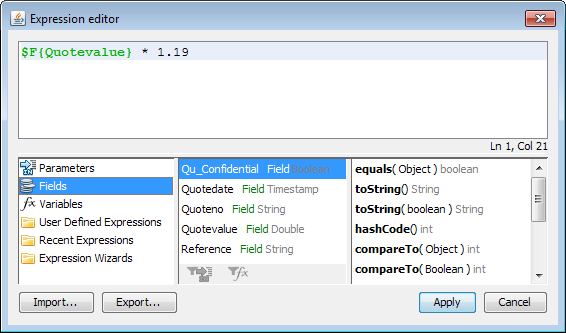
Double-clicking on a field name inserts $F{Name} into the expression.
Double-clicking on a method name inserts $F{Name}.Method() into the expression.
Field names ($R{Name}) must be entered "manually".
You can intersperse line breaks and spaces to improve readability.
Use the Apply button to save the expression.
Examples of expressions
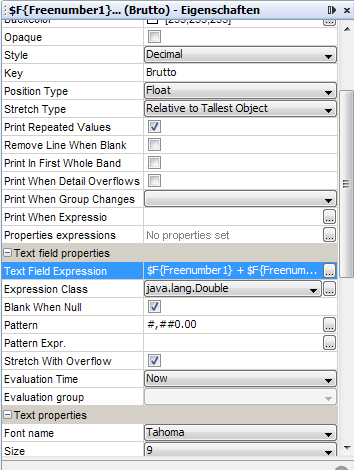
Freenumber1 + Freenumber2
The expression is $F{Freenumber1} + $F{Freenumber2}
This example shows the essential settings of a calculated field.
|
Property |
Value |
|---|---|
|
Style |
Decimal |
|
Text field expression |
$F{Freenumber1} + $F{Freenumber2} |
|
Expression Class |
java.lang.Double |
First day of the month in which a date lies
new Date( $F{Salesdate}.getYear(), $F{Salesdate}.getMonth(), 1 )
Expression class: java.util.Date
Pattern: dd.MM.yyyy
IF formula
Formulas known from spreadsheets
IF(a, b, c)
in Java is:
(a?b:c)
Interception of empty values
The example "first day of month" causes error messages if the 'Salesdate' field in CURSOR-CRM/EVI is empty for a dataset. In the following example, the same expression is packed in a suitable IF formula:
(($F{Salesdate} == null)
? new Date(0,0,0)
:new Date( $F{Salesdate}.getYear();$F{Salesdate}.getMonth(),1))
The actual expression in the third line is now always fed with correct data.
Name and token of the employee
This example results in the project manager in the form Last Name, First Name [token]. CURSOR-CRM/EVI also allows a so-called empty key (usually a question mark), which is intercepted here:
("#EMPTY-KEY#".equals($F{PjManager_Pk}))
? $F{PjManager_ShortCut}
:$F{PjManager_LastName} + ","+$F{PjManager_FirstName}+
"("+$F{PjManager_ShortCut} + ")"
Converting a date to a string
(new java.text.SimpleDateFormat("MMMM yyyy")).format($F{Salesdate})
Note that an object created with new is enclosed in parentheses and the format method of this object is used: (new …).format(…). The result is already of type 'String', which is a valid expression value, so that the whole thing does not have to be surrounded with a new string(...).
For example, the specified format MMMM yyyyy results in June 2007.
Prospect of success and expected value of an inquiry
In CURSOR-CRM, the prospect of success of an inquiry is stored as an integer between 0 and 100. The following expression gives the probability value as a real number between 0 and 1, which is more suitable for calculations:
$F{ChanceSuccessKey_KeyName} / 100.0
It is important that it says 100.0 and not simply 100 otherwise purely integer arithmetic would be used, and the result would always be 0.
Inquiry reports often process the expected value, i.e. value times probability. The Jasper expression for this is
$F{Projectvalue} * $F{ChanceSuccessKey_KeyName} / 100.0
Field label: $R{Expectation}
Day, Month, Year
|
Expression |
Result |
|---|---|
|
$F{StartDate}.getYear() + 1900 |
Year |
|
$F{StartDate}.getMonth() + 1 |
Month (1 to 12) |
|
$F{StartDate}.getDate() |
Day (1 to 31) |
Note that to create a date object, you must enter the year and month numbers in the uncorrected form. You get 24/12/2050 as follows:
new Date( 150, 11, 24 )
Time span in days
The following expression calculates the duration of an activity in whole days, counting both the first and the last day:
$F{EndDate} - $F{StartDate} + 1
Time span in months
The following expression calculates the duration of an activity in whole months, counting both the first and the last month:
($F{EndDate}.getYear()*12 + $F{EndDate}.getMonth())
-
($F{StartDate}.getYear()*12 + $F{StartDate}.getMonth())
+
1
Time span in years
The following expression calculates the duration of an activity in whole years, counting both the first and the last year:
$F{EndDate}.getYear() - $F{StartDate}.getYear() + 1
"Today"
The following expression returns the current date:
new Date()
Date comparison
The following expression returns a value indicating whether date A is before date B:
$F{A}.before( $F{B} )
Example of use: the end date of a contract can be empty, then the contract is unlimited. However, it can also be populated, meaning the contract is still running or has already expired. So there are exactly three cases. The following expression returns a character string that denotes the respective case.
( $F{ContEndDate} == null            ? "unbefristet" :
( $F{ContEndDate}.before(new Date()) ? "abgelaufen"  :
"laufend"
))
You can also group by this expression if you have sorted the data by ContEndDate.
Substrings
The substring method works as follows in Java:
s.substring(a,b) = Teil von Position a einschließlich bis b ausschließlich, wobei 0≤a<b
Totals
This refers primarily to totals, averages and the like over a variable number of datasets. Advanced uses include extracting values from individual specific datasets.
They are formed in Jasper using variables. Variables are managed via the View / Report Variables menu item.
Creating a variable
Example: the 'ProjectValue' field should be summed up for a group.
To do this, you create a variable with the following properties:
-
Variable name: ProjectValue_Total
-
Variable class: java.lang.Double
-
Calculation type: Total
-
Reset type (this means: under which circumstances does the variable take the initial value again): Group
-
Reset group: Enter the name of the group here.
-
Expression: $F{Projectvalue}; generally a dataset-related expression that you want to have summed up.
-
Initial Value Expression: can obviously be left blank.
A total defined in this way is only available at the end of a group or report, so it cannot be used as an overview at the beginning. In particular, you cannot express single values as a percentage of the total.
Predefined variables
The following variables are predefined in Jasper and cannot be changed:
-
REPORT_COUNT is the number of the current dataset, starting with 1; at the end of the report, for example in the Summary area, this is the total number of datasets.
-
Groupname_COUNT is the number of the current dataset within the current group,
Output of a variable in the report
You can drag a variable into the draft report like a simple field.
In expressions it has the name $V{Name}. You can also find them in the expression editor.
Totals of totals
Jasper allows you to add up totals that have already been formed (of course, you can also take averages of totals, that is, you can use a different calculation type).
Note, however, that the higher-level sum is told that its input data originates from a group. This is the only way Jasper can sum up the results correctly.
For this reason, set the following for the totals summation variables:
-
Counter type: Group
-
Counting group: Name of the subordinate group whose result you want to continue to use.
Label texts
In addition to data, a report must also output fixed texts. These are usually names for the adjacent data fields, but longer explanatory texts are also possible.
The style of the design object should be set to Label.
The labels of fields and entities as well as some other frequently used words like 'total' and 'page' are available in expressions as resources in the syntax $R{ResourceName}. The data type is always String.
The expression editor does not display the available resources. However, you can take them from the Reportname.properties file when editing the report, if Reportname.jrxml is the file you are currently editing. The names of the most important resources are listed in the sections below.
Label of a field
You get the label of a single field with $R{fieldname}.
Example: $R{Matchcode} is the label for the Matchcode field.
The label text is always current, even if the label is changed later using the field attributes.
Label of an entity
You get the label of a total entity with $R{entityname}.
Example: $R{Customer} stands for the label of the entire business partner entity.
Self-defined resource strings
In the 'JasperReports' node you will find a button called Labels. This opens a table in which you can store additional multilingual resources. These identifiers are not report-specific. They have the same content in all reports.
The names of self-defined resources always begin with C2_. All self-defined resources are available in all reports. The transfer to another system, for example from Test to Productive, is done manually.
This procedure is useful if such an identifier is to appear in several reports. It can then be changed centrally at one point.
Language code of the user client
To make a label text that only occurs in one report multilingual, you do not need to create a resource string. Instead, you make a case distinction according to language in the report itself.
You can get the current language of the user client with the expression
$R{LanguageCode}
It can assume the values de, en, it, si (subset of ISO 639-1).
Example
For English and Italian a specific text is explicitly indicated, in all other cases the German text appears:
($R{LanguageCode}.equals("en") ? "English" :
($R{LanguageCode}.equals("it") ? "Italiano" :
"Deutsch"))
The identifiers of fields and entities already have the correct language automatically.
Calculated access to resource strings
Background knowledge: The following formulas are equivalent:
$R{C2_PlzBereich6} /* Ressourcenname ohne Anführungszeichen (entspricht einem Variablennamen) */
str( "C2_PlzBereich6" ) /* Ressourcenname als String */
Application: Depending on the first character of the postal code, the following formula accesses the resource strings C2_PlzArea0, C2_PlzArea1, and so on:
str( "C2_PlzBereich" + $F{ZipCode}.substr(0,1) )
Sort
You set the sort order using the Sort options button in the report query. You can access this via the context menu of the entire report from the report inspector, or alternatively via the small button next to the preview button.
The sort options themselves are a simple list of fields to sort by
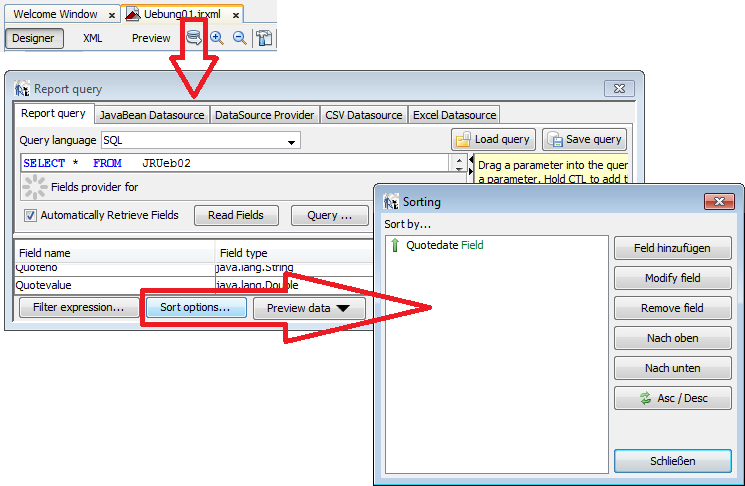
You can only sort by fields, not by expressions. Since Jasper 4 you can also sort by variables, but it is not clear what this does, because the value progression of a variable itself depends on the sort order.
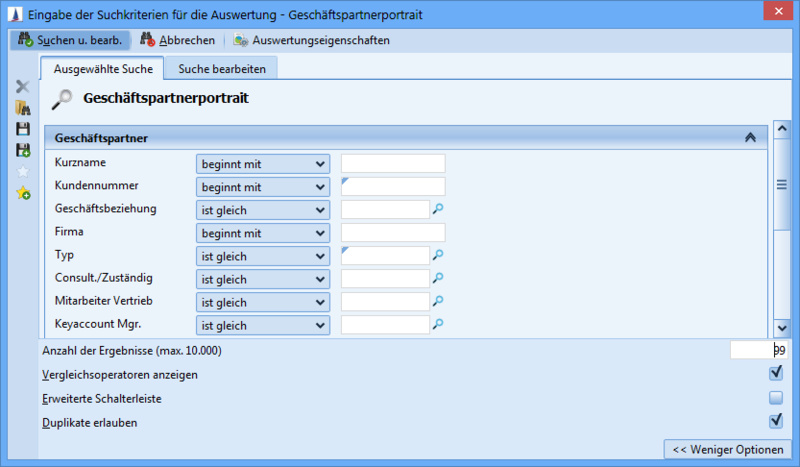
TOP-N sort order
Typical target: The five largest customers are to be selected, measured in the 'Turnover' field.
This must be set in two separate places:
-
You set the 'Turnover' field in the report by sorting it in descending order according to the 'Turnover' field as described above.
-
You can set this sorted list to be limited to five items during the search by changing the 'Number of results' properties. See the figure below:
Grouping
The basic task of Grouping is to structure the report. In addition, special grouping techniques form a powerful tool for managing the report.
A word processor like Word also has a structure in the form of chapters, sections, subsections, and so on. The difference: In Word, you type in all headings individually. In a report, instead you define a rule that uses data fields to describe where a new chapter is to begin in the report. Then you define another rule that specifies where a new section is to begin within a chapter. A third rule describes subsections, and so on. Usually, datasets that have one characteristic in common are then also visually adjacent to each other. This is where the term "group" comes from.
In a report, a group begins with a special area, the group header. There you already have access to the first dataset of the group. You can therefore place a field in the group header to use it as a dynamic header field.
The group header is followed by the individual datasets (and, of course, inner groups), and at the end comes the group footer, where you can display a subtotal, for example. In the group footer, you also have access to the last dataset of the group.
The groups are managed and edited with the Report Inspector.
Add group
The context menu (right mouse button) of the root element in the Report Inspector contains the item Add Report Group. This starts a small wizard where you can choose the group name and what to sort by.
Example 1
Customers should be sorted by the City field ($F{City})
A good group name is "City". The City field can be selected using the drop-down menu.
You now see two new areas in the draft report: "City Group Header 1" and "City Group Footer 1".
Place a field in the group header with the expression $F{City} in large font. This will be the heading of the respective "chapter".
You now also have a new variable: $V{City_COUNT}. This is the consecutive number of the dataset within the group. In the group footer, it is the number of datasets in the group. Place the following two text objects in the group footer to take advantage of this:
-
Identifier
-
Style: Label
-
Expression: "Number of customers in " + $F{City}
-
-
Number field
-
Style: Integer
-
Expression: $V{Ort_COUNT}
-
A simple mechanism runs in the background in Jasper: Whenever a customer is in a different city than the previous customer, Jasper outputs a group footer (for the previous city) and a group header and resets the corresponding variables
Example 2
Activities should be grouped by year
It is quite possible to group according to a freely defined expression. However, it is important that you can also create a suitable sort order.
This works in the same way as for simple grouping. Only difference: The group expression is not simply $F{StartDate}, but
$F{StartDate).getYear() + 1900
(As a reminder: getYear() returns the figures 97, 98, 99, 100, 101, ... )
Another useful case concerns grouping by customer. You sort the data by the customer match code, but then group by the customer's $F{Pk} as a precaution. Nevertheless, enter the match code in the group header. The groups are displayed in the order of the match codes.
Remove group
The Delete Group command can be found in the context menu of both the group header and the group footer.
Pseudo groups
You can use the group mechanism to have more areas or to control the calculation of variables. Such a group, which does not actually group any data, is called a pseudo group.
A pseudo group is simply a normal group with a cleverly chosen group expression.
Frequently used pseudo groups:
-
At report level: the group expression is a constant, for example zero. The group has a group header only once, at the beginning of the entire report, includes all datasets, and has a group footer at the end of the report. These can replace or supplement the "title" and "summary" areas. By nesting several such groups, you even get several pseudo report titles and pseudo summaries.
-
At group level: You create another group within your group with the same expression. In this way you have two group headers instead of just one.
-
At detail level: The group expression is $V{REPORT_COUNT}. Group header and group footer appear for each dataset. They are additional or alternative detail areas. For example, if you have so many fields that you need more than one page for the detail area, you can use this technique.
In combination with the area attribute "Output if", this technique also allows you to output a variant of an area depending on the condition.
Subreports
A subreport is a small report within the main report. It represents its own data set, and you can use (almost) all reporting techniques (fields, groups, totals, sorting, diagrams...) within the subreport.
Usage examples
A subreport can contain a data list for the detail dataset. For this you need a table search (see below). You can find examples of such subreports in the business partner portrait. These subreports print lists of contact partners, inquiries, contracts, and so on. This would not be possible with a single large main search and groupings - the search would return a list of all combinations of contact partner/inquiries/contracts among themselves, and the report would no longer be able to unravel them.
Instead of a data list for the individual dataset, a subreport can contain the main search. This is useful, for example, to display this data in a different way, usually in condensed form and/or as a diagram. Such a subreport may also be required to handle the number of datasets or a total amount (see Receiving data from subreport).
The layout of a subreport can be greatly reduced and in extreme cases only a total or a small diagram can be output.
Add table search
You only need a table search for the data assigned 1:n to the individual dataset, i.e. the "Data lists" case.
The first step is to add an advanced search to the complex search. If you specify a table search as the type, this search is also described in this section.
You should use the name of the complex search followed by a label suffix (i.e. JR_ReportName_ContactPerson) as the name of the search.
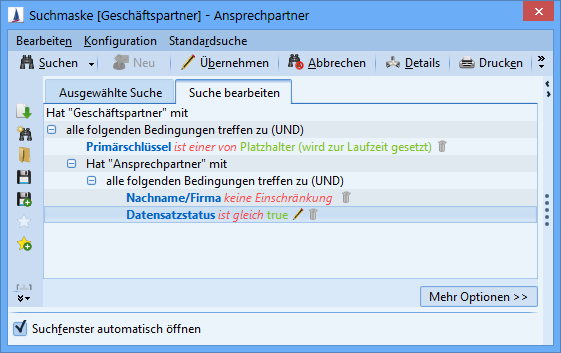
The table search must start from the same entity as the main search. You only need the primary key field and then append the entity that you want the subreport to be about as the Has-a branch below it. Here is an example of a table search that provides the contact persons for the business partners (who come from the main search):
This table search must be linked to the main search. This is done as follows:
-
In the main search, pass the primary key to an export parameter (double-click on the Export parameter field). Give the parameter a name and make a note of it.
-
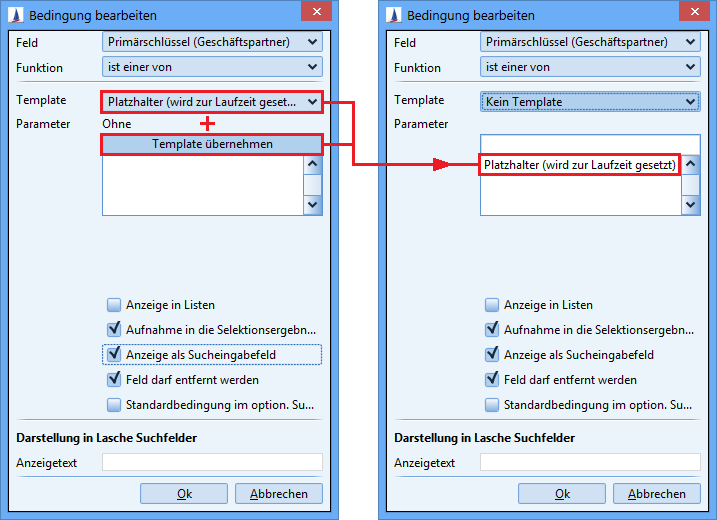
In the table search, you make the following settings for the primary key of the business partner:
Template Placeholder (filled at execution time). Transfer this template to the list below by clicking on Add template. See the screenshots below. Set the check mark Export in search result.
-
In the table search, also connect the parameter to the primary key as an input parameter.
-
Pay attention to the alias names of the table search (see Naming Conventions).
This enters is one of - Placeholder (filled at execution time):
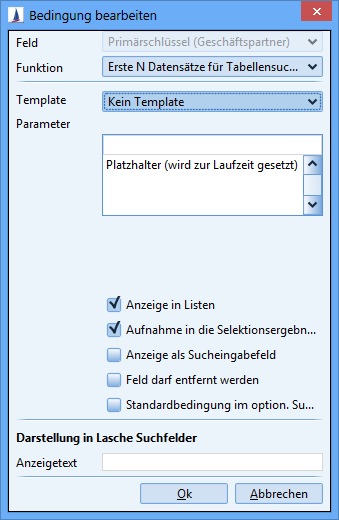
If you want the report to work so that the user can limit the number of datasets in the subreport (for example, business partner portrait), you must use the First N datasets for table search function instead of is one of, also together with the Placeholder (filled at execution time) template. This function works differently and also somewhat more slowly, because it searches for a maximum of N datasets in the table search for each dataset in the main search.
Add subreport
To add a subreport to the main report, click the Add subreport button in the admin console (JasperReports mask). CURSOR-CRM then generates a subreport that is already correctly integrated in the main report.
Edit subreport
To do this, open the main report for editing and right-click on the subreport placeholder.
The context menu then contains the option of opening the subreport draft.
The properties of the subreport placeholder (also in the context menu) also allow you to exchange data with the subreport.
Hint
Initially, the subreport placeholder occupies the entire page width (595 or 751 points). Of course, you can make the placeholder smaller. Then you should also adjust the displayed width in the draft subreport. The Edit / Report Properties menu item is used for this purpose. First change the unit of measurement to "Pixel". Now you can enter exactly the value that the subreport placeholder has as width in the main report.
Receiving data from the subreport
Frequent application: Subreport calculates a number, main report processes this number further.
Example
The main report usually only knows the number of datasets at the end. Now you want to display some numbers as a percentage of the total number. Then a subreport must determine and return the number of datasets.
Procedure:
-
Any variable of the subreport can assume the role of "sender". You can also use a predefined variable such as $V{REPORT_COUNT}. This is particularly well suited for our example. The value of the variable at the end of the subreport applies. You do not need to modify anything in the subreport. You only have to remember the names of the variable.
-
In the main report, create a variable as a "recipient", for example $V{Number_Datasets}. A recipient variable has the following special features:
-
The calculation type is System. Instead, the actual calculation type is entered in the subreport return definition.
-
The data type must of course match the variables in the subreport.
-
-
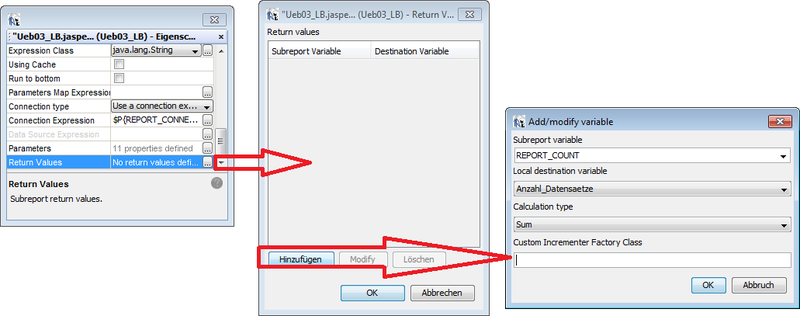
In the main report, right-click the subreport placeholder. In the properties go to the 'Subreport (other)' tab, and the 'Subreport Return Values' sub-tab. There you connect the two variables by entering the variable names with 'Add' (see illustrations).
You can send and receive any amount of data into and out of the subreport. You only have to create the corresponding variables or parameters.
The received value is only available in the next report area. Solution, if necessary by means of a pseudo group.
In other words:
-
If the sending subreport is in the "title" area, you do not have its return value in the "title", but only in the first group header or in the first detail area.
-
If the sending subreport is in the "detail" area, you only have its return value at the next dataset, not at the current dataset.
Solution: You prepend a help section to the report area in which you need the return value by means of a pseudo group (see Groups chapter). You move the sending subreport into this section. Or (alternatively) add an additional subreport whose only task is to return the return value.
Example: Calculating with the number of datasets
The variable $V{REPORT_COUNT} of the main report contains the total number of datasets only at the end of the main report. Occasionally, however, this number is needed earlier, sometimes even at the very beginning, in order to use it in calculations (such as a number as a percentage of the total number). The "Reporting time" field attribute is not a solution here; it only covers up the problem superficially.
Solution: You create a new subreport (in the Admin Console). This subreport is based on the main search, i.e. not on a table search. You place this subreport at the beginning of the report. You have it return its own REPORT_COUNT variable.
If you want to evaluate the total number in a title page, you must do without the "title" area and replace it with two pseudo groups at the report level - the first group header (very small) contains the subreport, the second (larger) is designed as a title page. This is explained in more detail below under Examples with selected exercises.
Send data into subreport
This is a bit easier and more flexible than receiving.
Implementation:
-
Create a parameter (not a variable!) in the subreport with the following properties:
-
Name: any, but remember it for the main report (best to copy and paste)
-
Data type: must correspond to the desired value from the main report
-
Deselect the 'interactive query' checkbox if checked.
-
-
In the main report, right-click the subreport placeholder. In the properties go to the 'Subreport (other)' tab, and the 'Subreport Parameters' sub-tab. Enter the parameter names and any expression. The main report then sends the value of the expression to the subreport.
In the subreport, use the parameter in expressions with the syntax $P{Name}; i.e. like a variable, only with $P instead of $V.
You can send and receive any amount of data into and out of the subreport. You only have to create the corresponding variables or parameters.
Diagrams
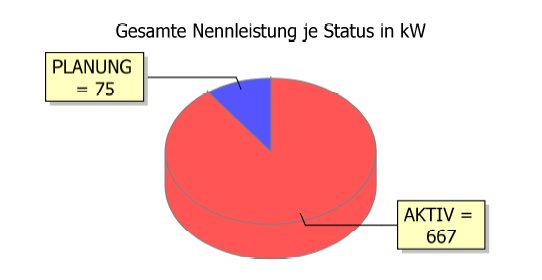
First example: A simple pie chart
Objective:
One piece of pie per group X with the sum of the field Y.
Procedure:
-
Sort by X: Data / Report query / Sort options
-
Group by x: View / Report groups
-
Create variable Sum_Y, which is added to $F{Y} and reset per group.
-
Make summary section visible, if not already done.
-
Insert new diagram; open diagram properties with the right mouse button. Diagram Data tab, followed by the Details tab; enter the following details there:
-
Expression for key: $F{X} ("pie slice")
-
Expression for value: $V{Sum_Y} ("size of the pie slice")
-
Labels
You can change the content of the yellow pie slice descriptions using the corresponding expression below the expressions for key and value. Depending on the field type of $F{X} the $F{X} can be itself or for example $F{X}.toString().
Labels with percentages
If you require the percentage of the total in the name of the pie slice, you must output the diagram in a separate subreport.
First return to the Administration Console and add a subreport to the report. Assign the main search to the subreport (so that you have the same data in the subreport). Then open the iReport Designer again.
The subreport is represented by a gray rectangle. Open the subreport and create a new parameter in the subreport (View / Report Parameters menu item). In this example it would be called Total_of_the_main_report.
Go back to the draft of the main report. Create a variable for the total amount of $F{X}. In this example it would be called $V{TotalAmount}.
In the properties of the gray rectangle, which represents the subreport, the communication between the main and subreport is set up by linking variables and parameters. Link $P{total_of_the_main_report} to $V{TotalAmount}.
The total amount is now available in the subreport in all expressions.
Create the required groups and the diagram in the subreport.
The following expression returns strings like ABC(35%) and XYZ(65%). It can be used as a label expression in the diagram or as a simple text field.
$F{X} + " (" + (new Integer((new Double(0.5+100.0* $V{Summe_Y}.doubleValue() /$P{Gesamtsumme_vom_Hauptbericht}.doubleValue())).intValue())).toString() + "%)"
Colors and transparency of the pie slices
The Row Colors attribute can contain a list of colors. Jasper takes the colors first from this list, then from a standard palette.
The Foreground Alpha attribute determines the degree of transparency of the pie slices. Value must be a real number between 0 and 1. The value 0 makes the pie slices so transparent that they become invisible. You can achieve a good result with 0.5.
Second example: Bar chart
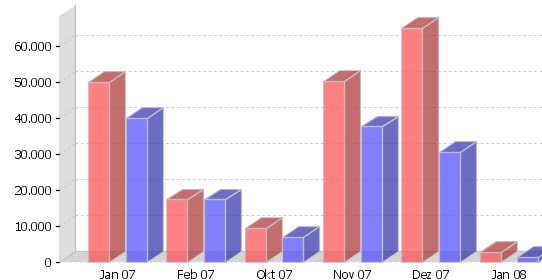
Here you see two independent fields grouped by month.
In the Jasper nomenclature, the red columns (query value) form one series and the blue columns (weighted query value) form another series.
Therefore, you must create a series in the diagram properties. In contrast to the pie chart, there is therefore another dialog box for editing a series with the following four input fields:
-
Series expression: this is the label of the series as it appears in the legend and should therefore be a constant. Typical serial expressions are $R{Projectvalue} and query value.
-
Category expression: corresponds to the x-axis, in this example the months, and should return the group expression (suitably converted into a string) when mapping group results.
In the diagram above it is:Javanew SimpleDateFormat("MMM yy").format( $F{Salesdate} == null ? new Date(0,0,0) : new Date($F{Salesdate}.getYear(),$F{Salesdate}.getMonth(),1) ) -
Expression field values: this is the column height, usually a variable that provides the group sum.
-
Expression identifier: can remain empty.
You would expect that the category expression corresponds exactly to the group expression and only the identifier expression contains the same as a string. In Jasper's current state, however, the identifier expression seems to be ignored.
Crosstabs
A crosstab is a tabular summary of data according to two characteristics. An example of meter installation statistics in CURSOR-CRM/EVI is shown here:
|
Year / District |
North |
South |
Total |
|---|---|---|---|
|
2005 |
12 |
14 |
26 |
|
2006 |
22 |
23 |
45 |
|
Total |
34 |
37 |
71 |
Create a crosstab
The crosstab can be found as the Crosstab object in the Palette window.
Drag the object to the area design. The crosstab wizard then opens.
The first step of the wizard prompts you to enter a sub-dataset. The default sub-dataset with the name of the report stands for all data of the report and usually fits.
The further steps are self-explanatory.
Edit the crosstab
The crosstab is edited on its own tab, which contains two additional windows. There you will find the variables used in the crosstab and you can also modify them.
When you edit a draft report again later, this tab is missing at first. You open it via the context menu for the crosstab.
Provide image data in reports
The logo of a business partner and the pictures of contact persons and employees are to be printed in the portrait report. This task includes only the technical basis, but not the adaptation and redesign of existing reports.
Requirements
The image data is stored in the database in binary form. Loading and converting requires more resources than normal text fields. Images should therefore only be inserted into portrait reports that contain little data. Processing is not designed for list or even mass data reports. If some reports are provided with image data and these are used in the cockpit or on masks, the client's memory consumption also increases. The size of the reports depends largely on the size and number of images. Therefore, it may be necessary to increase the client's memory settings.
Search configuration
The logo of the business partner or the images of contact persons and employees can be included as a search result field in the search like normal text fields. Only 'is empty' or 'is not empty' are available as restricting functions. It is important that the 'Allow duplicates' option must always be set.
It makes no difference whether images are displayed in the main search or in table searches for subreports. However, you should avoid selecting multiple image fields in one search.
Design in the editor
The crosstab can be found as the Image object in the Palette window.
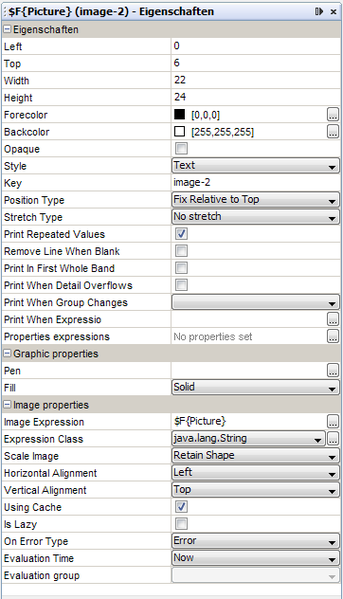
Drag the object to the area design. First a file selection dialog opens. However, you can cancel this and make the necessary settings later using the object properties.
-
Position Type: Running
-
Stretch Type: No stretch
-
Expression: e.g. $F{Logo}
-
Image Return Type: java.io.InputStream
-
Scale image: Keep shape
-
For error type: Empty
-
Alignment: Top left
In order to be able to view the expression in the designer, the image data is transferred to the temporary report database. The available field also has the data type java.io.InputStream.
For further information on the subject of "Images in the report", please refer to the help of the iReport Designer, which is available to purchase.
Examples
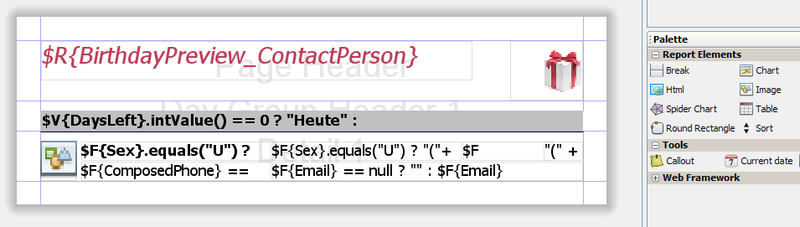
-
The result of the birthday preview then looks like this in the cockpit:
-
A customized contact person portrait as well:
Provide external images in reports
External images can be included in the report as URLs.
Requirements
The images used must be available with unrestricted read access on an internal web server. Both the Rich Client and the application server must have direct access to this without having to specify a proxy configuration or SSL certificates. The function of the web server is only to make available any image in the format .png, .jpeg or .gif via a fixed and unique path. It must be ensured that the URL of this server does not change and that the path to the images does not change either. Otherwise, the affected reports must be adjusted manually. The system administrator must ensure that the system is fail-safe.
Design in the editor
The following settings should be set on the image field:
-
Position Type: Running
-
Stretch Type: No stretch
-
Expression: Z.B. "http://intern.cursor.de/gift.png"
-
Image Return Type: java.lang.String
-
Scale image: Keep shape
-
For error type: Empty or error
-
Alignment: Top left/right
If the error type "Error" is set, the user receives an error dialog indicating the missing, invalid path. Such a report cannot be executed without errors again until the image is available again or the report has been modified in the Designer.
Images from the Icon Library
From version 15.2 and higher, icons from the icon repository (image entity) can also be used in reports. As a user, you can easily select and add available images to a report. For this purpose, the layout of the report editing was created to clearly display the new configuration options.
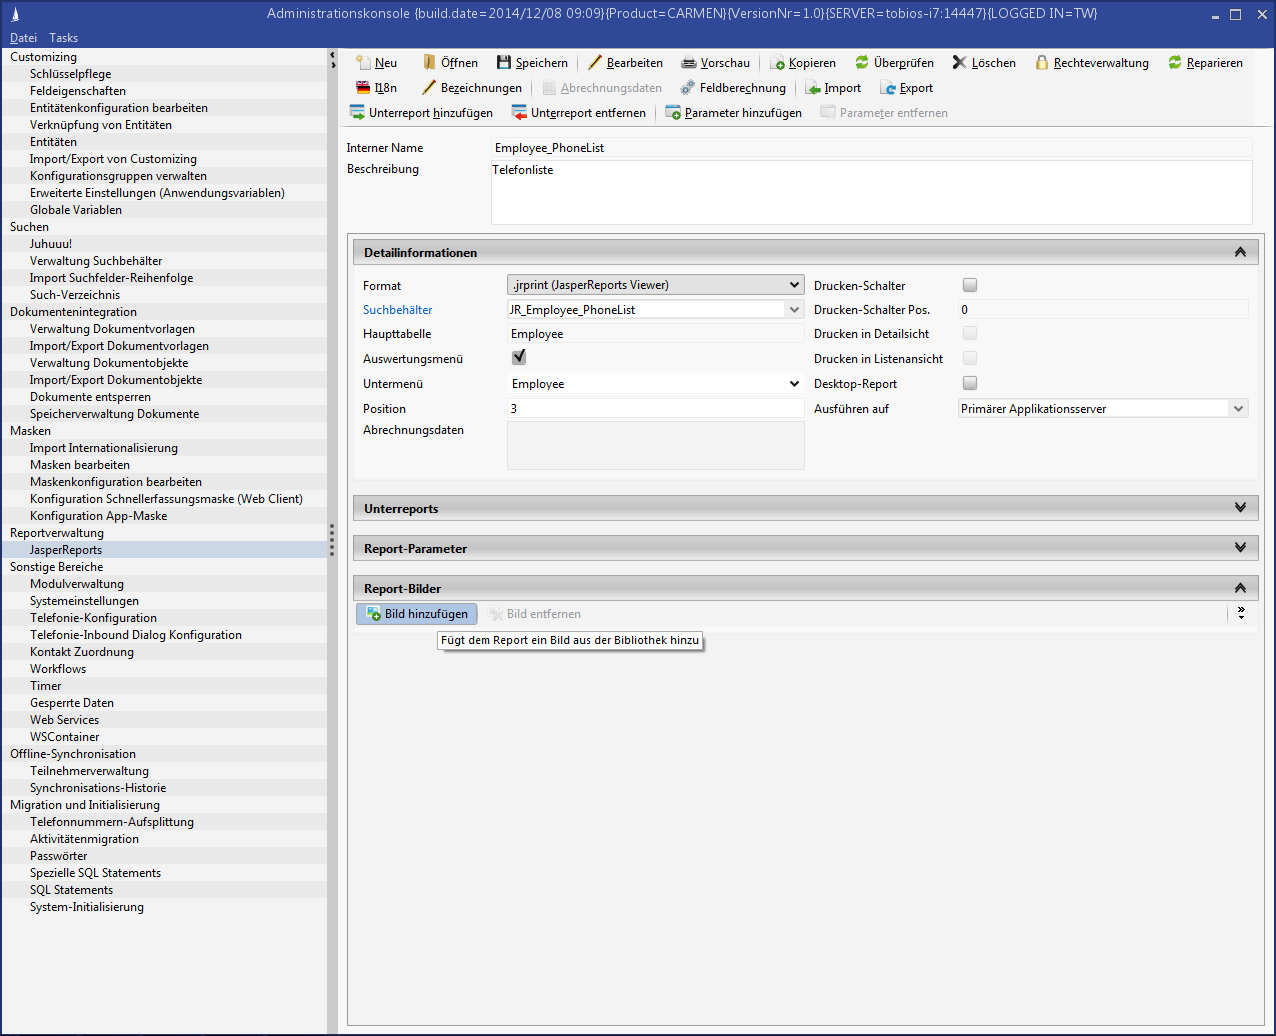
Figure: Configuration mask of a report
New images can be added to the report from the icon library. Each image is displayed with the unique indicator.
Figure: Images in the library
The images are available in the Report Designer as parameters. The images are also available in all subreports.
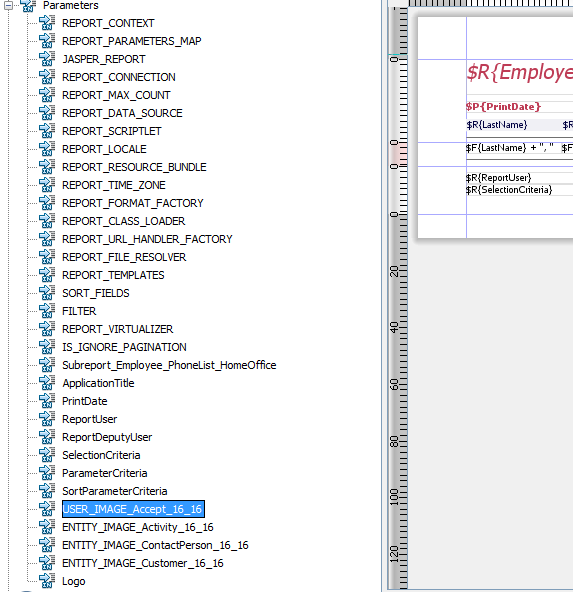
Figure: Images in the report
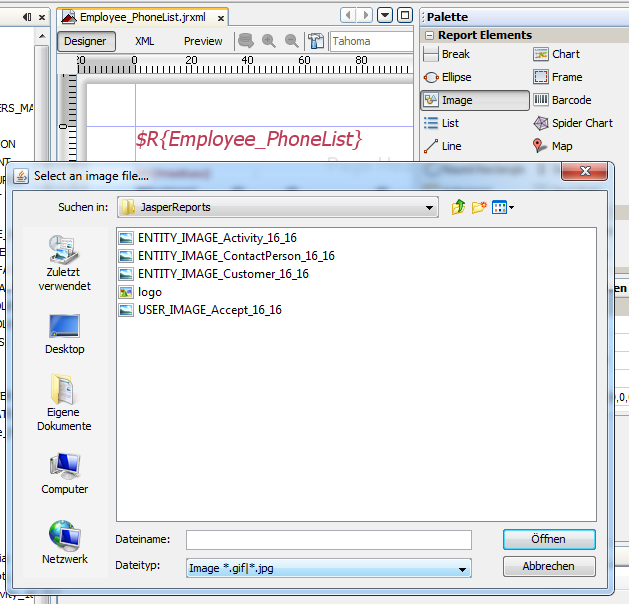
A new image is dragged onto the report using the palette. The image file can be selected from the temporary report editing folder.
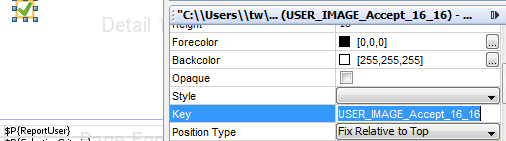
The following settings should be set on the image field:
-
Key: The name of the parameter, e.g. "USER_IMAGE_Accept_16_16"
-
The path in the image field is removed when the report is saved, since the images are passed as an InputStream during execution. Therefore, the name of the parameter as the key is very important and must not be forgotten.
The newly added images are now output in the executed report.
Figure: Report with images from the library
Since an exported report only consists of an XML file, it does not contain images, but only references to the unique image name. Images must be transferred between the systems using Customizing transport. Make sure that new images and the report are in the same Customizing package.
Hyperlinks
Fields can be hyperlinked. A hyperlink can call:
-
A website
-
An entity or list in CURSOR-CRM/EVI (similarly to links in internal emails)
-
A section within the report
Hyperlinks to datasets
Clicking on such a hyperlink causes the CRM running in the background to open a mask with the corresponding dataset.
Basically, there are three different notations for the URL of a hyperlink to entity datasets:
-
Simple notation:
<Entityname>=<PrimaryKey> --- Beispiel: Activity=891ni23f8sdlAc -
Advanced notation:
-
Open a single dataset: <VersionName>://'<Entityname>&pk=<PrimaryKey>'
Example: CARMEN://'Activity&pk=891ni23f8sdlAc' -
Open the list view of several datasets: <VersionName>://'<Entityname>&pk=<PrimaryKey1>$!!$<PrimaryKey2>$!!$<...>'
Example: CARMEN://'Activity&pk=891ni23f8sdlAc$!!$0aj238agsjd21dAc$!!$...$!!$...' (See below for an example of a variable)
-
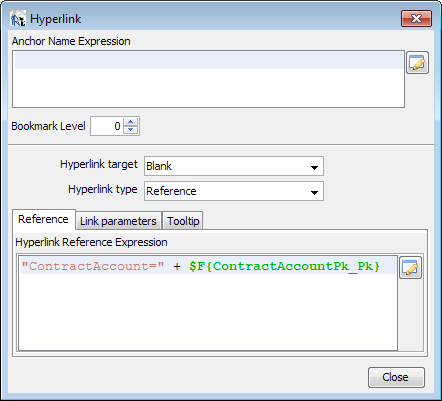
To insert the hyperlink, open the Hyperlink menu item via the context menu (right click).
Please note the following settings:
-
Hyperlink target: Blank (must be typed in manually, otherwise the hyperlink will not be generated correctly)
-
Hyperlink type: Reference (must be typed in manually, otherwise the hyperlink will not be generated correctly)
-
Expression: This expression must result in a string whose content corresponds to the URL.
Example
In the following example, the beginning of the link is defined first ("ContractAccount="). The placeholder $F{ContractAccountPk_Pk} is used to dynamically insert this string into the link. This means that the system jumps to the ContractAccount entity. The primary key placeholder is then replaced at runtime by the content of the field ([F]ield) of the dataset currently being processed. The result could be the string "ContractAccount=TX1729CnAc" for example.
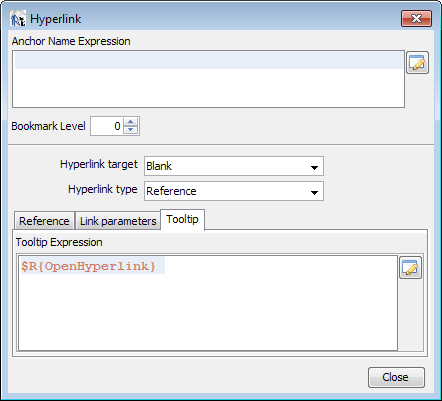
The Report Viewer always displays a help flag (tooltip) showing the URL to be opened. To obtain a more meaningful tooltip, you can store any string expression in the Tooltip tab. The reports delivered with CRM use the $R{OpenHyperlink} placeholder in all hyperlinks, which stands for "Open".
Linking a diagram
The bars or pie slices of diagrams can also be hyperlinked. By clicking on a bar or a pie slice in the diagram, you can jump to the detailed data within the report.
However, a link always refers to a set of datasets (those that have been combined into a group in this diagram) Therefore, the link has to be defined differently. It is not possible in the link definition to access the primary key of a dataset directly using the $F{} placeholder, since multiple primary keys have to be grouped. Therefore, you must first create a variable that is filled at runtime and finally inserted into the link.
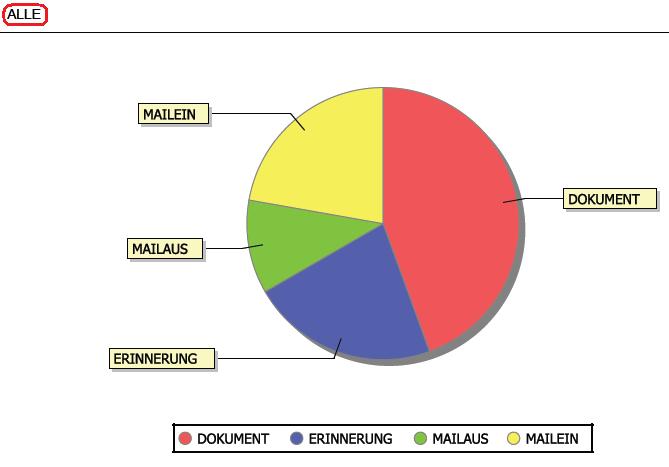
This example report ("Weekly Review") groups all activities in a subreport according to their type. The "ALL" link shows all activities of the last week in the list view. By clicking on an appropriate "pie slice", only the activities of the selected type are displayed. For the two link types (All / Group) the following two variables must be defined.
Variable for a link to multiple datasets
A link to multiple datasets is similar to a link to a single dataset (extended notation with program name before the colon). The primary keys are attached to each other, separated by the character string $!!$.
This is achieved by a variable that takes its own old value when updating and adds the Pk.
Example
Example: Let the name of the variable be allpk. Then its expression must be:
($V{allpk == null ? "" : ($V{allpk} + "$!!$")) + $F{Pk}
Explanation: The new primary key (Pk) is preceded by the already constructed character string and the separator.
The hyperlink expression is now
"CARMEN://'Activity&pk=" + $V{allpk} + "'"
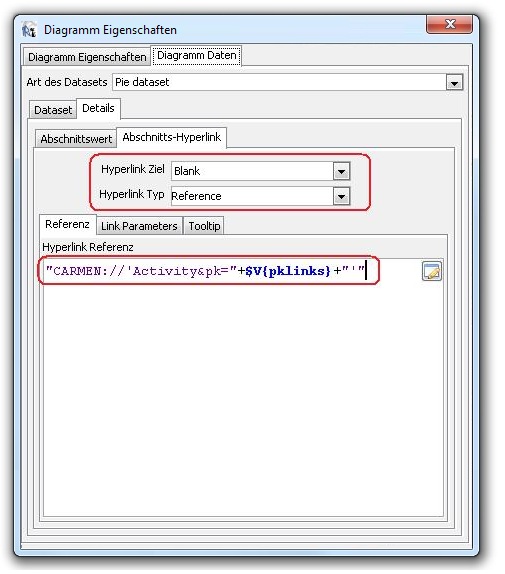
Links on the individual "pie slices" are defined in the same way, but the option is hidden in a few submenus. Right-clicking on the diagram takes you to the "Diagram Properties" menu. The "Diagram Data" → "Details" → "Section Hyperlink" tab takes you to the following dialog. It is identical to that of a text field. A link is created again with the parameters Hyperlink Target = Blank and Hyperlink Type = Reference. The variable $V{pklinks} is to be used in the hyperlink reference string accordingly.
Limitations
By adapting the link syntax to the CURSOR-CRM link functionality, it is now possible to jump to the application from the various output formats of a report. However, the use of hyperlinks does not work with every output format. The following table shows which links can be used in which format:
= works
= not available
Limitations on hyperlinks
|
|
Links to labels/field values |
Links to diagrams |
Comments |
|---|---|---|---|
|
.jprint (JasperReportsViewer) |
|
|
|
|
.pdf (AcrobatReader) |
|
|
Diagrams are displayed as images in PDF |
|
.csv |
|
|
|
|
.html |
|
|
The CRM primary key must not contain a '#' |
|
.rtf (Word Rich Text) |
|
|
Diagrams are displayed as images in Word |
|
.xls (Excel) |
|
|
|
Hyperlinks to jump targets within the report
Hyperlinks of this type allow you to navigate within a report as a drill-down. For example, a summary of the results is displayed on the title page. You can jump to the page with the corresponding detailed results using hyperlinks in the rows.
Two hyperlinks are technically required, specifically one clickable link at the start point and one jump target at the target point.
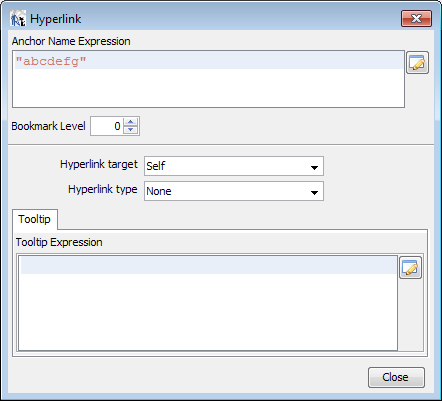
Jump target:
A "None" type hyperlink is attached to any object located at the point to be jumped to. The anchor name expression must return a unique name, in this case "abcdefg", as the target to jump to. The anchor name expression can also comply with field contents.
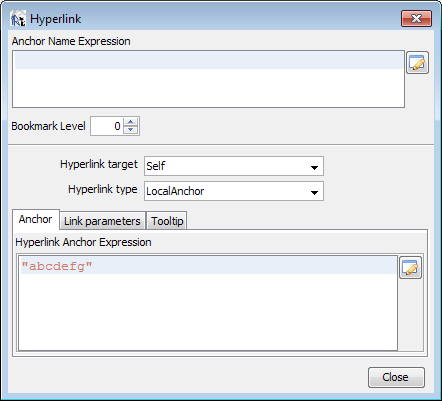
Reference to the target:
At the point where you want the clickable hyperlink to appear, you attach a hyperlink to any object that contains the link to the target. This is the same string or string expression as the previously defined jump target, but it is entered in the anchor expression hyperlink. The LocalAnchor link type must be typed in manually, because the input field of iReport does not work correctly.
In this example, a fixed string, namely "abcdefg", was used as the target. The string expression can also be composed dynamically from unique field contents. This can also simply be a primary key field.
Bookmarks
If you want to create bookmarks for PDF output, complete the 'Anchor' field and set the bookmark level accordingly. The level determines the nesting depth, starting with the number 1. The generation of bookmarks only works with direct output to PDF format via CURSOR-CRM, since the corresponding parameters have been configured there. The export from JasperViewer or in Designer does not take bookmarks into account.
Calling an entity in CURSOR-CRM/EVI
The 'Blank/Reference' hyperlink type is selected. The URL expression must now contain the entity name followed by the primary key of the entity.
Expression: Entity=Primary Key
"Activity=" + $F{Pk}
Hyperlinks to search
Searches can also be opened by passing parameters.
Again, the hyperlink in Jasper must be of the Blank/Reference type.
The syntax of the URL expression is:
Syntax:
"CARMEN://SEARCH/?Cu&pk=1r6qh2m1b2kuk7olExtendedSearch&po=0,~an=City.Cu,~fn=ef,~vu=" + $F{City}
In this example, the search, whose Pk is 1r6qh2m1b2kuk7olExtendedSearch, searches for datasets using the value of the City field as the input value.
You can create the composite link in the search designer (not in Jasper) as follows:
-
The field for the search parameter must be configured with "No restriction".
-
The field for the search parameter must be configured as a search input field.
-
The search must first be saved.
-
Still in the search designer, change the field to "is equal to XXX" without saving the search.
-
At this point, click on the "Send by email" icon, which is located in the vertical icon list on the left side of the search designer.
-
The email generated in this way contains the link to the myCRM search.
Hint
If the email does not work because, for example, Outlook is not installed, configure the server-side mail dispatch for the employee you are logged on as. This is documented elsewhere. The email with the URL will then appear in a preview window.
Tips for presentation
Refining reports on masks
A setting option has been created for mask reports to display the report with or without the toolbar. The configuration is done in the GUI Builder, because the reports are already placed on the mask. A setting option has been added in the properties editor: Show toolbar. If no toolbar is to be displayed, the report is automatically adjusted to the size of the report panel; this size cannot be changed by the user.
Formatting as percent
In Jasper, you do not calculate with percentages, but represent the share of a thing as a real number between 0 and 1. For example, 50% behind the scenes is simply treated as 0.5.
The corresponding percentage representation is formed from this for display in the interface.
To do this, set the following pattern for the number field:
#,##0 %
Styles
Menu item: Format / Styles
In iReport you can format an object as you like, for example you can change fonts. To simplify this, Jasper offers styles. A style is a complete field formatting.
Several useful styles are predefined in CURSOR-CRM reports:
-
Decimal for real numbers (Double, BigDecimal);
-
Integer for integers (Integer, Long);
-
Text for strings (String);
-
Label for field labels
It is not possible to change these styles centrally in CURSOR-CRM/EVI.
Hide zero values
If a field is empty, Jasper prints null instead of not printing anything. You can change this by selecting the Empty if NULL field attribute.
Conditional hide
To display a field or section only under certain conditions and otherwise hide it, use the 'Print if' or 'Display if' property. There you enter an expression that results in a Boolean.
Output if ContEndDate is in the past:
$F{ContEndDate}.before($P{PrintDate})
Hide a section completely:
false
(Useful to hide a section but keep it invisible)
Total page number
To display the number of pages (for example in the form Page 1 of 37), use the PAGE_NUMBER variable. However, you have to change the evaluation time of the text field to Report, otherwise you get the current page number.
You cannot create Page 1 of 37 by a single string expression. You need two text fields, both of which output $V{PAGE_NUMBER}, but the evaluation time is different.
Covering translations in reports
If an evaluation in the main report contains free text fields (e.g. Freetext1) and if a subreport from another entity also contains the free text field of the same name, the translation of the main report and therefore of the main entity has been covered. In other words, $R{Freetext1} only provides the translation from the activity (subreport) although the main report business partner also outputs its free text field.
The fix now creates its own translation for the Free Field activities:
-
$R{Freetext1}: Free text1 for the business partner (main report)
-
$R{Freetext1_Ac}: Free text1 of the activity (subreport)
For duplicate field names, the entity ID is appended to the field name. It is possible that the normal field name $F{...} is different from the translation field name $R{...}. This is because although each subreport accesses its own data source, the translation for the main and all subreports is kept in one file only.
Scriptlets
JasperReports supports Java expressions in fields and variables. Complex programming beyond this must be swapped out into a scriptlet class. This class must be provided to the iReport Designer, the CURSOR-CRM/EVI Client and application server. For this reason, the class can only be provided by CURSOR Software AG.
The 'JRCustomizer' project has been set up in the same way as for the special customizing of diagrams. The compiled library was copied to Customizing2/ext/jasperreports/jrCustomizer.jar and made available as a project file.
Scriptlet classes can intervene in the calculation in all phases of report execution. In addition, your own methods can be provided. A current list of classes and methods can be found in the library under /META-INF/*.txt
// de.cursor.jr.CursorScriptlet.class

Public class CursorScriptlet extends JRDefaultScriptlet {
public String reverse(String text, String delimiter)
throws JRScriptletException { ... }
}
The scriptlet class must be stored in the report properties.
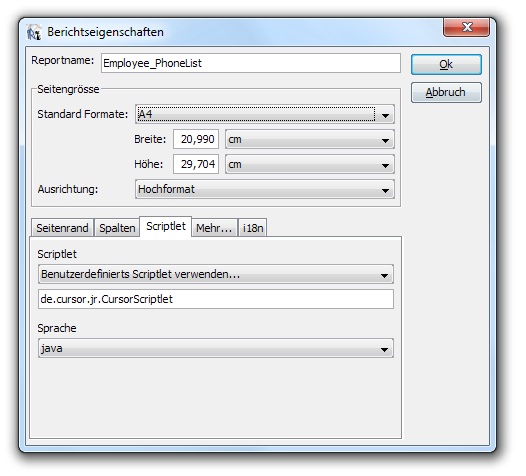
JasperReports provides a parameter for access. Here you can poll values and call defined methods:
$P{REPORT_SCRIPTLET}.reverse($F{ProjectStatusKey_Desc}, "/")