Basics
With the CURSOR geo analysis you can display your destination-related data (e.g. business partner, contact person, objects, projects) directly on the map and analyze it. This way, you straightaway determine your regional need for action. Easy selection of display criteria from the selection list offers an excellent analysis of data material. You can easily save or print out your graphical result as grafic file.
The "Open geoanalysis" button is available in the list or detail view. This is only displayed if the corresponding entity is enabled for the geoanalysis (entity configuration).
It is also applicable for your safety requirements. Values of characteristics do not leave your local network. Even the OSM data (geo codes, map tiles and street information) are not provided by public servers but by the CURSOR cloud. The high-quality maps are from the free provider openstreetmap.org.
CURSOR geo analysis is an optional module.
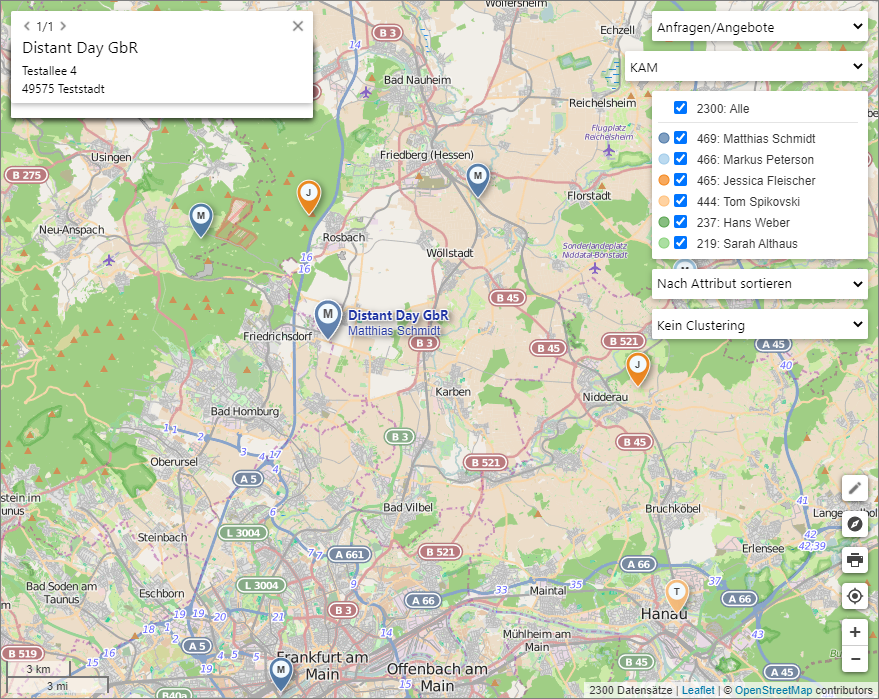
Figure: Display of business partners in geoanalysis
Show searched datasets on map
In the CRM-system the corresponding datasets, e.g. business partners, are determined over a search.
To display the datasets you are looking for on the map, proceed as follows:
-
Open the search window for business partner.
-
Enter the search criteria and trigger the search with the ENTER ↵ button or by clicking

.
-
Click the switch Geoanalysis. Map view opens in an own level.
The own location is displayed by default if the address is geocoded.
If several pins are located at exactly the same point on the map due to the same coordinates, this is visualized by a small addition in the pin (number of pins) based on the pin visible there.
Execute geoanalysis without search result
After entering an entity for which geoanalysis is enabled, the geoanalysis can be opened by clicking the corresponding button in the entity toolbar, even if no search result is available in the list. The geoanalysis opens without markers loaded on the map. The combo box for selecting groups/attributes is inactive. The legend is not displayed.
An Empty-State-Info asks the user to mark an area and then load markers
Reloading geo-objects within a radius on the map
On the geoanalysis map, the circum search can be performed using the "Marker in region" tool. An additional entry "Load additional markers" loads markers that are located in the selected area, even if they were not previously part of a search result from which the geoanalysis was started or if the geoanalysis was started without a search result from an entity enabled for geoanalysis. The legend is updated to match the loaded markers.
Reloading geo-objects within a polygon on the map
On the geoanalysis map, you can draw a polygon using the "Draw polygon" or "Draw rectangle" tool. An additional entry "Load additional markers" loads markers that are located in the selected area, even if they were not previously part of a search result from which the geoanalysis was started or if the geoanalysis was started without a search result from an entity enabled for geoanalysis. The legend is updated to match the loaded markers
Finding datasets using the geographic search
Geoanalysis offers you the possibility to search for datasets with geographical information with a simple graphical selection on the map. This enables you to determine all house connection customers of a certain street section, for example. To do this, simply select a map’s sub-area of your interest and, with a further click, determine all datasets of the selected entity (e.g. business partner) that are located in the selected area. To do this, follow the instructions below:
-
Select the desired area by circumference, rectangle or any polygon, as described in section Select placemarks on the map.
-
Clicking

will now search for the datasets in this area and add them to the map.
You can then also open the found datasets in the list view of the CRM and continue to edit them. To do this, use the jump button

The map allows a maximum of 2,500 markers/datasets to be displayed at the same time. If your selected range would contain more datasets than can be added to the map, a note will appear. Then narrow down your selected area and repeat the search.
Determine analysis characteristic and analyze properties on map
In order to analyze a specific characteristic (e.g. sales region) on the map, you can select this from a list. After selection of the analysis characteristic you will find underneath the list the legend about all property values of the selected characteristic. Locations adopt the color according to the legend and visualize the characteristic values that way.
Use characteristic groups
To keep an overview over that number of characteristics you can control the display over the characteristic groups. Per area (entity) available characteristics (attributes in GEO table) can be joined to several groups. In case characteristic groups in the data structure of the selected area exist, the drop-down box Groups becomes active and allows selection of a characteristic group. In the drop-down box Characteristics now the characteristics of the pre-set groups are provided for selection.
Legend view
In order to provide a better view of the displayed value you have several legend views to choose from. A suitable legend can be selected in the legend area via the drop-down box.
Select/ deselect all attribute values
A checkbox "All" is available above the legend entries of the individual attribute values. Behind it the total number of pins visualized on the map is displayed.
-
If this checkbox is checked, all legend entries will be checked
-
When unchecking this checkbox, the check mark for all legend entries is removed
-
If the checkboxes of the attribute values are in a "mixed state", i.e. there are checkboxes checked/unchecked, this is visualized by a dash ("minus") in the checkbox of the entry "All"
-
If the legend entries are checked/unchecked manually by the user, the state of the checkbox of the "All" entry adapts so that it correctly represents the state of the checkboxes of the legend entries
-
When changing the sort order of the legend entries, the previous selection is discarded, i.e. all entries are checked again (exception: ? (= empty values and "Other")
Reason: When changing the sort order, it cannot be excluded that previously checked legend entries fall into the category "Other" and are therefore no longer visible individually in the legend. Conversely, entries that were previously grouped under "Other" can be displayed in the legend when the order is changed.
Defaults of the selected attributes
After opening the geoanalysis and selecting an attribute, the checkboxes of the attributes are in the following state:
-
Empty value (e.g. "Not specified" or "?"): Unchecked
-
More: Unchecked
-
All other values: Checked
The same state can be found if you change the attribute within the geoanalysis or change the sorting of the legend entries.
The legend entry "etc.", which summarizes attributes, is renamed to "Other".
Defaults for sorting attributes
By default, attributes are sorted by frequency (descending) when opening the geoanalysis in the legend. The "Legend sorting" entry is located in the drop-down box for selecting the sort order. The user can change the sorting of the attributes in the legend as desired using the selection box available for this purpose
Show characteristic overview
As user you can view all characteristic values for a business partner by clicking the concerning locality marker. Clicking on a location marker opens an overview of characteristics. It displays all property values for the relevant business partner. The overview window is faded out through a close symbol. The company name function as link in order to open the business partner in a new level in the CRM-system.
Print map section
The current map section can be exported and printed as an image file for further processing. First, the desired map section is selected on the screen by moving and zooming the map. The Print button

transforms the map section into a PNG file. You need to save the PNG file. After that, print out the graphic file over a program of your choice.
Updating the display of markers
With a click on the update button

the underlying datasets of the geoanalysis are updated, so that subsequent changes to the datasets are also visible in the geoanalysis.
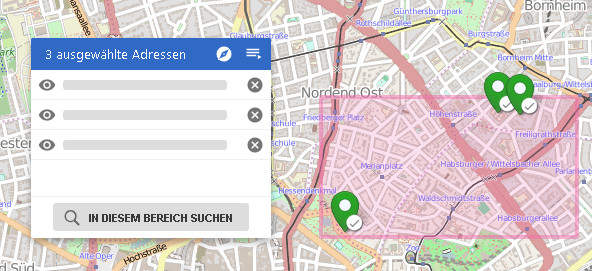
Selecting placemarks on the map
To select a certain group of placemarks directly on the map, two selection tools are available for you. To do so, first click the Edit symbol

In the next step you decide which section on the map you want to mark. A square or polygon symbol is available for selecting the area marking:
Once you have clicked the symbol draw the corresponding area with your mouse. The marked data (e.g. business partners) are displayed in an additional box.
Perform route optimization
To calculate an optimal route over various waypoints, first select the corresponding placemarks like explained above. The data being selected this way (like business partners) are listed now in a dialog where the button Route optimization can be found. Click on that button to have the system calculate a reasonable roundtrip that takes all waypoints into account. The route will be visible on the map straightaway. If the route is to be started at a specific waypoint, click the small triangle symbol at the respective placemark.
Export route as GPX file
When a route has been calculated and displayed on the map, you can save and export the interim destinations with a click on Download as GPX file for compatible navigation software.

Processing of a route-optimized list of datasets
With geoanalysis, addresses can be compiled into a route via route planning. Task scheduling (e.g. equipment changes at properties) can be optimized if the tasks can be scheduled in the order of the route. Thus, knowing the duration of the tasks, it would also be possible to schedule and communicate specific times for the start of the tasks. When opening the selected addresses in a new level for the purpose of further processing, the route-optimized sequence of the datasets is adopted.
In the results of the geoanalysis, the position of each result within the planned route is included for further processing in order to be able to take this into account in the further processing of all results – for example via the BPM process.
-
Sequence is temporarily available
-
Sequence can be integrated into the process and processed there
-
Sequence can be discarded after execution
Display of large marker quantities
The user can operationally plan the Smart Meter rollout for his network area with the geoanalysis. Accordingly, only the map section of one's own network area is of interest. The zoom level is always appropriately close during operations on the map. Via the geographic/geometric search per polygon drawn over a street/block of houses, a very high density marker quantity can be loaded. This is filtered according to certain criteria (Smart Meter rolled out yes/no) and then passed on to a process via reselection or opened in a CRM list view. Detailed attribute information is not useful in this view due to the high marker density and is hidden.
The initial zoom of the geoanalysis is fixed configurable via PropertyMapper entry. This applies if the geoanalysis was started without previously selected entries in the search results list. If the geoanalysis is performed with selected data, the zoom level is scaled to a suitable size as usual. Possible values: 0 (whole world) to 18 (street level)
INSERT INTO PropertyMapper( Pk, id, property, propertyValue, propertyType, principal, isCustomizing, Active, CreateDate, CreateUser, UpdateDate, UpdateUser, Status, RightPk, ClientNo, MassData, CustLayer)

VALUES ('GeoanalysisInitialZoom', '/GeoanalysisSettings$!!$initialZoom', '', '6', 'SYSTEM', '', '0', '1', getDate(), 'TECH_USER', getDate(), 'TECH_USER', null, null, null, 0, 'CN');
The location zoom is also fixed configurable via PropertyMapper entry. This is used when using the "Zoom to current location" function. Possible values: 0 (whole world) to 18 (street level)
INSERT INTO PropertyMapper( Pk, id, property, propertyValue, propertyType, principal, isCustomizing, Active, CreateDate, CreateUser, UpdateDate, UpdateUser, Status,RightPk, ClientNo, MassData, CustLayer)

VALUES ('GeoanalysisCurrentLocationZoom', '/GeoanalysisSettings$!!$currentLocationZoom', '', '15', 'SYSTEM', '', '0', '1', getDate(), 'TECH_USER', getDate(), 'TECH_USER', null, null, null, 0, 'CN');
Furthermore, the size of the steps when decreasing/increasing the radius for the circum search can be set via PropertyMapper entry. The specification is in km. Standard here is 50 km.
INSERT INTO PropertyMapper( Pk, id, property, propertyValue, propertyType, principal, isCustomizing, Active, CreateDate, CreateUser, UpdateDate, UpdateUser, Status, RightPk, ClientNo, MassData, CustLayer)

VALUES ('GeoanalysisCircumSearchStepWidth', '/GeoanalysisSettings$!!$circumSearchStepWidth', '', '50', 'SYSTEM', '', '0', '1', getDate(), 'TECH_USER', getDate(), 'TECH_USER', null, null, null, 0, 'CN');
The statements are specified in MSSQL syntax in each case. For Oracle databases getDate() must be replaced with sysdate.