Basics
The feature opens up various possibilities in the representation of your data. As far as permitted by your permission you have the possibility to configure and save own charts.
The following chart-types are possible:
-
pie chart
-
doughnut chart
-
Bar charts
-
Line charts
Depending on the chart type, you can configure the underlying chart data and appearance: Field, chart axes, color, pattern filling or interpolation.
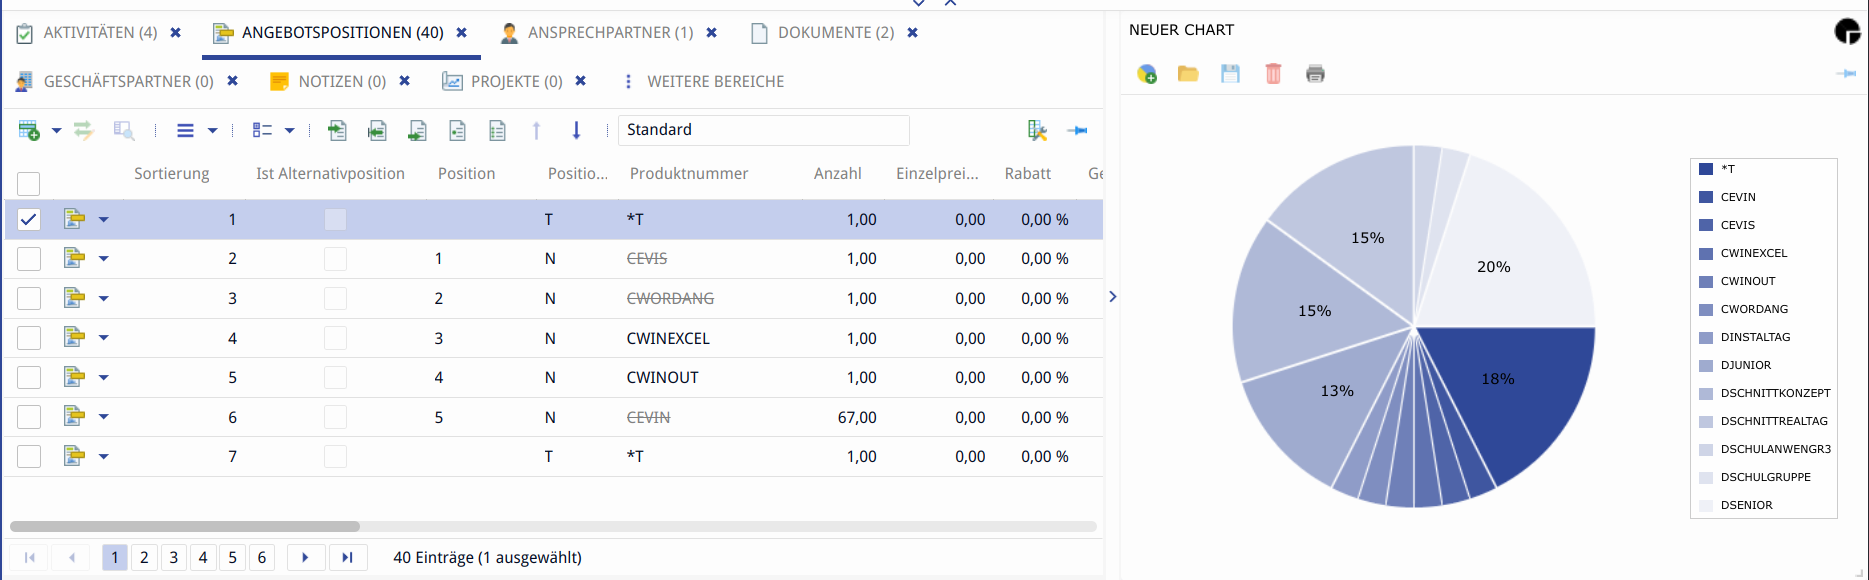
You can also display the charts in the list view by dragging the angle symbols upwards. By default, the charts are hidden.
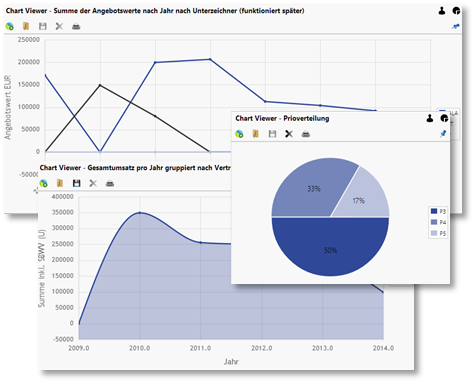
Chart repositories are possible for complex analyzes for decision-makers. Once configured - always available in due consideration of the permission concept.
Working with charts
Creating a chart
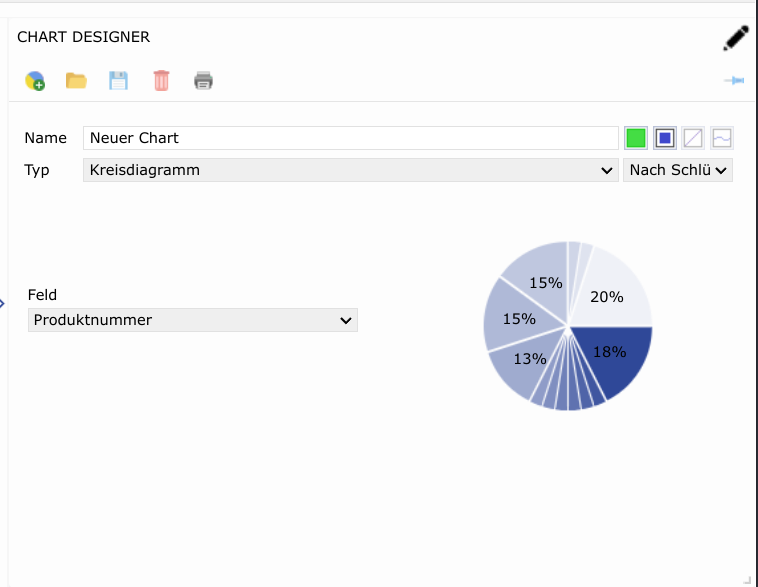
How to create a new chart:
-
Click the button

Add chart
-
Assign a corresponding name, select type, field, colors, tonality or interpolation. The result is displayed as preview.
-
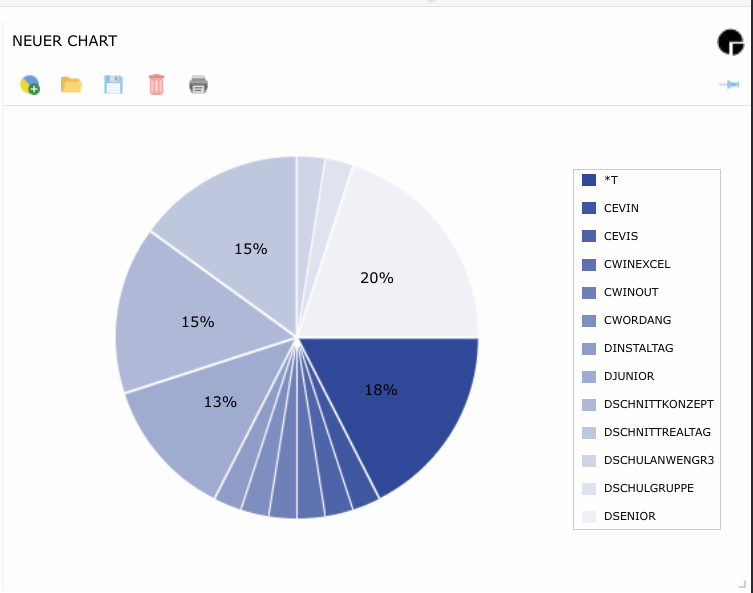
Click on

Save.
-
Click on the icon

to exit the edit mode.
Deleting a chart
How to delete a chart:
-
Open an available graphic using the button

Open chart.
-
Delete the graphic by clicking on the button

Delete.
Editing a chart
How to edit a chart:
-
Switch with a click on

to the editing mode. You can recognize the editing mode by the pencil symbol
-
Make your changes.
-
Click on
Save.
-
Click on the icon
to exit the edit mode.
Printing a chart
You can print any graphic. This is done in two steps.
-
Click on the icon

-
Save the PDF-file. You can now open and print the chart in your default program.