Basics
In the sub area, linked datasets are listed to the dataset displayed in the main mask. Each tab shows the number of subordinate datasets.
-
You can create new datasets and assign them automatically via the New button.

-
Button

Assign starts a merger in which available datasets can be assigned.
-
Button

Sub area search triggers a sub area search.
-
Button

List view switches to the list view of the subordinate datasets.
-
Using the button

Multi selection, you can trigger a desired action for multiple datasets.
-
In the search field you can use the button
Unknown Attachment
to execute a fuzzy search.
-
Button

Configure columns starts the column customization.
-
Click on the tab
Unknown Attachment
to switch to the configuration view of information areas.
-
Button

Unknown Attachment
triggers the table export to Excel (two formats are available: xls or csv).
If there are more than five datasets, you can scroll through the results at the bottom of the screen.
|
|< |
to the first page |
>| |
to the last page |
|
<< |
10 pages back |
>> |
10 pages forward |
|
< |
one page back |
> |
one page forward |
Determination of the default tab
-
To define an information area as the default, pin the tab using the icon

On the next opening, the focus is on the pinned tab (to be recognized by the symbol).
Action menus
To ensure uniform operation on traditional PCs and touch devices, actions on datasets in lists can be triggered using an action menu.
By clicking on the area symbol of a dataset, you can open the menu with available actions. The actions can vary according to the area type (document, business partner, etc.).
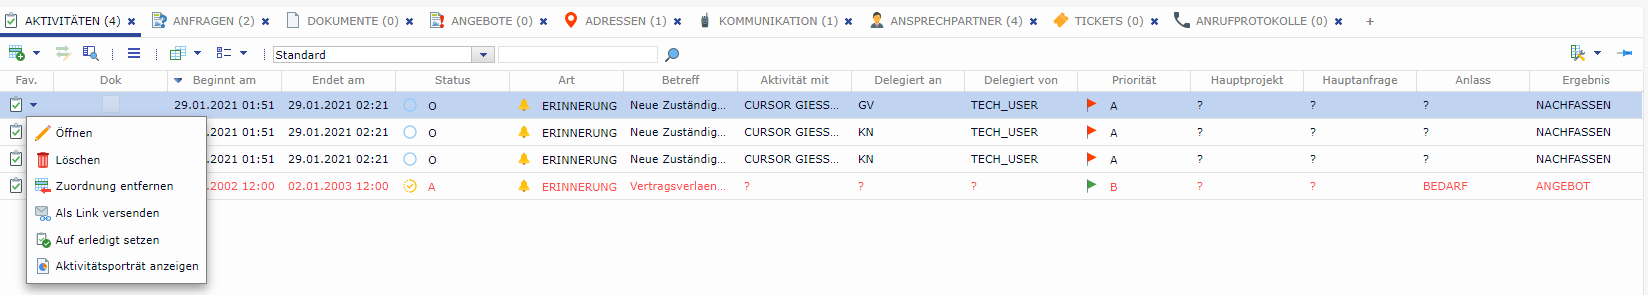
Figure: Action menu 'Documents'
Open datasets from search result lists in a new level
For the normal list views and in sub area lists, it is possible to open individual datasets as well as the entire list in a separate level (tab).
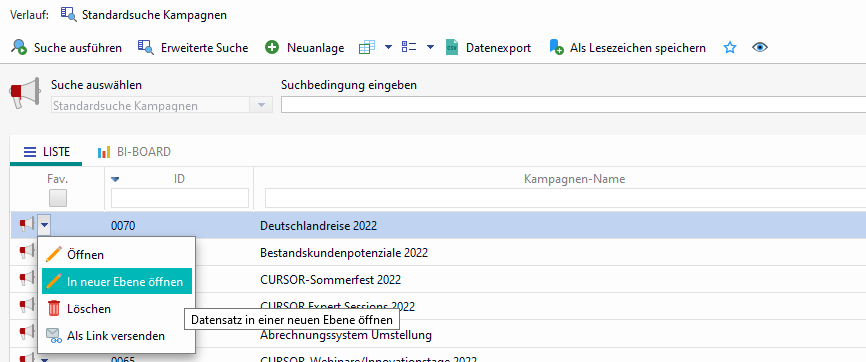
Figure: Open dataset from list view in a new level
Customizing columns
User-specific column customization – column width, arrangement, visibility, and sorting
The Web Client Supports the "Drag & Drop" column customization. To start the customizing dialog, click the icon
Configure columns.
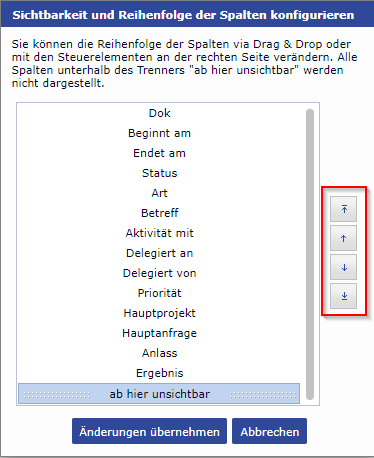
Figure: Column configuration
Drag and drop the columns up or down. All columns below ::: invisible from here ::: are hidden. Alternatively, you can use arrow buttons. To apply the changes, click the button of the same name.
Multi-dataset actions for lists
In order to execute an action on several datasets, you must choose the dataset using CTRL + <mouse click>. By clicking on the icon
![]()
Multi selection, you can start the desired action.
The following multi-dataset actions are allowed for lists:
-
Delete all selected datasets (with a security query).
-
Generate the links and write them into the mailing-window for all selected datasets.
-
Set all selected activities to DONE.
-
The document files are opened for reading for all selected datasets.
-
The document files are added as mail attachments to the mail delivery window for all selected datasets.
-
For all marked sets, the document files are packed server-side as a zip file and offered for download (as a local copy).
-
Remove assignment.
-
XLS or CSV export
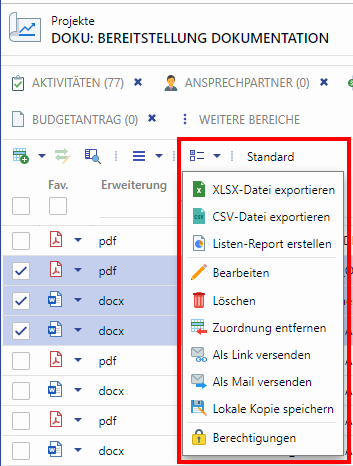
Figure: Simultaneous deletion of several activities
Fields with an attributed relation
A particular way of linking two datasets is the attributed link. Unlike a normal link, which purely consists of the connection of two datasets, the attributed link also contains one or more attributes. These attributes refer to the link.
The attributes are displayed in the List view or in the sub area and can be edited there. To start the dialog, click the icon
![]()
Edit the attributes of the relation.
-
Boolean fields are displayed as check boxes
-
Lookup fields are displayed as a selection list
The change is confirmed with the OK button.
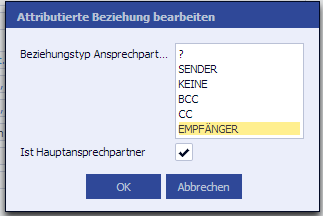
Figure: Edit relation attribute
Display in sub area
For each area the last user-defined state to show or hide a sub area is stored per user. By clicking on the plus tab in the sub area the dataset numbers are determined for the individual areas and the entities with dataset number greater than 0 are positioned at the beginning of the list. Entities without datasets are sorted alphabetically.
On the + Add sub area tab, a filter field of the available sub areas is displayed in the toolbar.
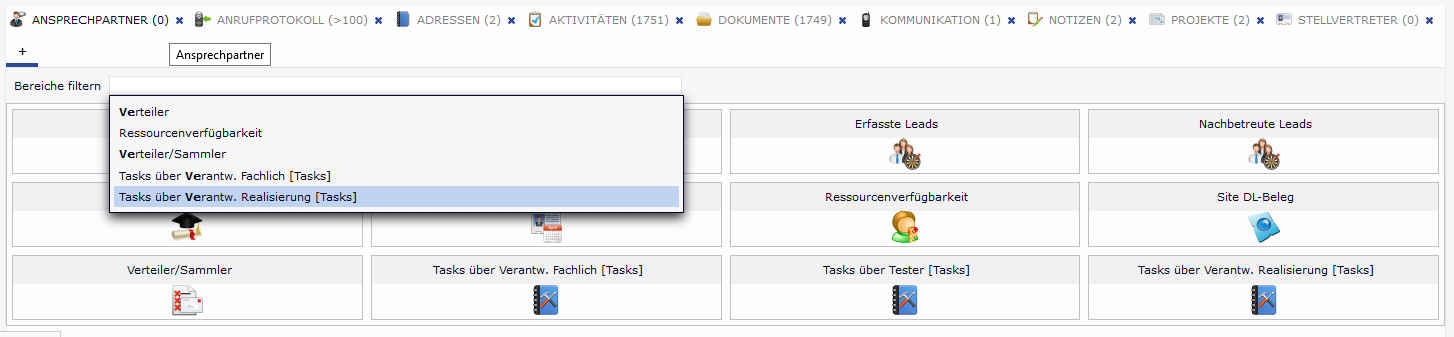
Figure: Filter function in the sub area
The filter field provides a suggestion list with the sub areas based on Sub area name contains Input value (e.g. "tact" provides "contact person"). The entry is highlighted in the suggestion entry. After selection of a suggestion, it will be switched to the tab of the displayed sub area.
Business graphics
The feature opens up unimagined possibilities in the representation of your data. Each user can configure and save its own graphics (if he/she has the corresponding permissions).
The following chart types are possible:
-
pie chart
-
doughnut chart
-
Bar charts
-
Line charts
Depending on the chart type, you can configure the underlying chart data and appearance: Field, chart axes, color, pattern filling or interpolation.
By clicking on the printer button, you can export a graphic as PDF document, save, print or archive it. You can define preferred charts with a pin button as default charts. Each time you call the sub area, your chart favorite will be re-drawn and displayed.
Chart repositories are possible for complex analyzes for decision-makers. Once configured - always available in due consideration of the permission concept.
Creating a chart
How to create a new chart:
-
Click the button
Add chart
-
Assign a corresponding name, select type, field, colors, tonality or interpolation. The result is displayed as preview.
-
Click on

Save.
-
Click on the icon

to exit the edit mode.
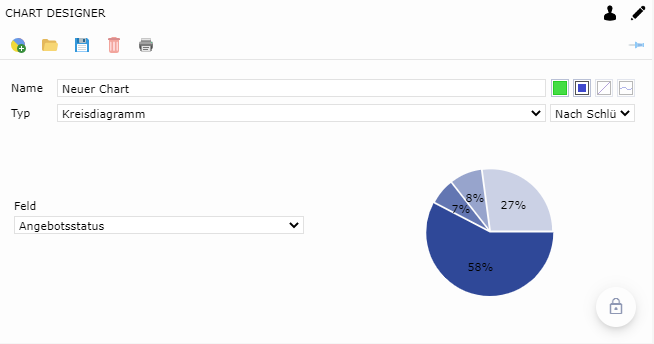
Figure: Editing Mode
Delete graphic
How to delete a chart:
-
Open an available graphic using the button

Open chart.
-
Delete the graphic by clicking on the button

Delete.
Editing a chart
How to edit a chart:
-
Switch with a click on

to the editing mode. You can recognize the editing mode by the pencil symbol
.
-
Make your changes.
-
Click on
Save.
-
Click on the icon
, to exit the edit mode.
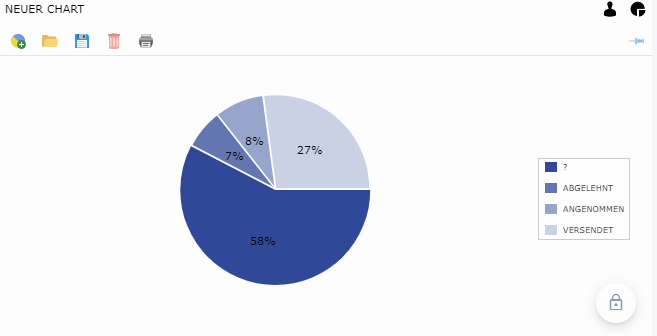
Figure: View mode
Print graphic
You can print any graphic. This is done in two steps.
-
Click on the icon

-
Save the PDF-file. You can now open and print the chart in your default program.