Basics
In the sub area linked datasets to the dataset displayed in the Main window are listed (1:n-relations are shown).
This is how you show the sub area to display linked datasets
-
Open a dataset in the Main window.
-
Click onto an entry field in the main mask with the right mouse button.
OR
Click the desired dataset in list view with the right mouse button.
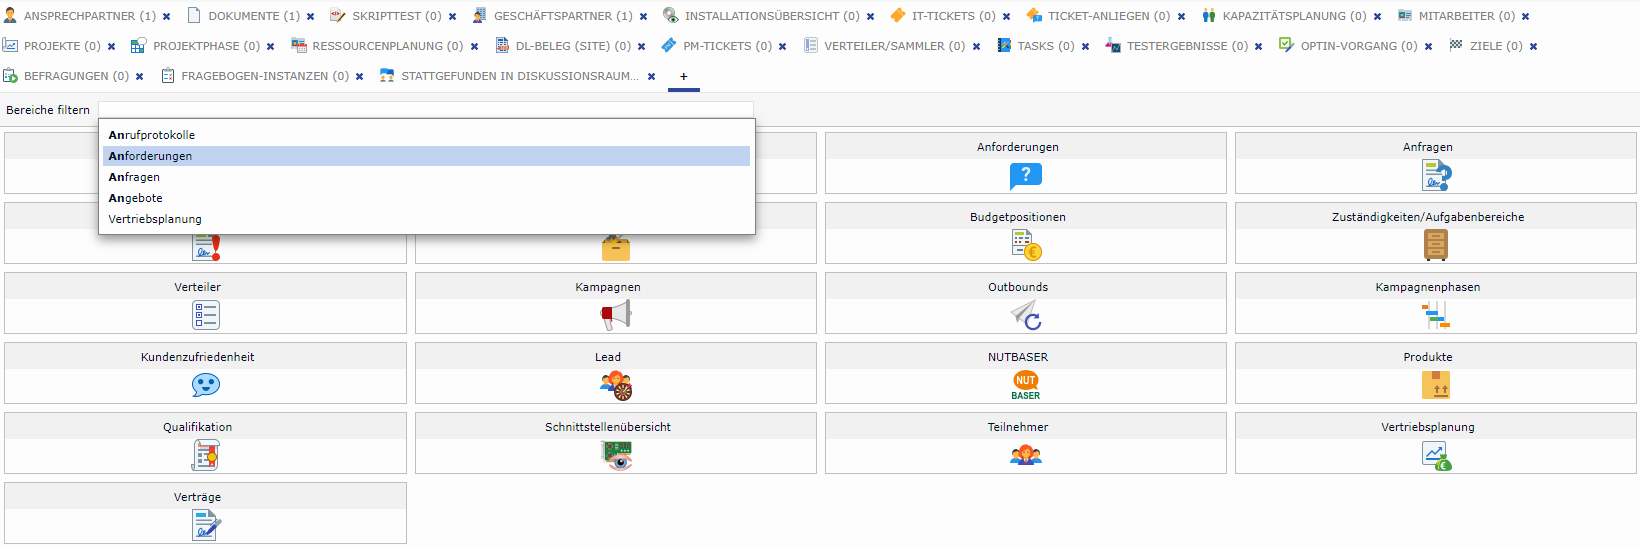
The context menu opens. Select the desired entity, which is supposed to be displayed at first position in the sub area. -
The sub area is visible with focus to the selected entity.
If you have deactivated the option Navigate in the tree using a single click you can open the main window with double-click on the symbol in the tree. The accompanying datasets in the sub area of the main window are displayed. If you have activated the option, use the key combinations.
The number of datasets in the sub range is displayed on the flap. Areas with several datasets are positioned on the left hand side.
Control of the sub range
Once the sub range is opened you see a default configuration at first. With the switches you can change and save the behaviour of the sub range for good. Your settings take priority over administrator's settings.
Selection as default sub window to parent entity (by toggling)
-

When the main window is opened this tab is displayed for default -

The tab is not focussed when opening the sub range.
Display of sub range to parent entity
-
By clicking on the icon

Hide, the sub area is hidden. Flabs are still visible. -
By clicking on the icon

Show, the sub area is is shown.
-
By drag & drop of the divider

Selection of tabs in sub range
-
Clicking the symbol [x] on the tab hides the tab
-
Clicking on the tab [+] shows available hidden tabs. Double-clicking the symbol of an information area shows the tab again.
-
Several information areas can be filtered by entering the name of the area into the filter field.
When selecting the tabs in sub view it is recommended to deactivate the user preference Tree / Hide empty nodes. At first, all tabs with "0" datasets are displayed. In the next step you mark out the tabs not required.
In addition the performance of the display is improved.
Control via key combination
The following key combinations are provided:
|
Key |
Action |
|
CTRL + f7 |
Show sub area. Branches/linked entities to active datasets are displayed in a dialog window. The ENTER ↵ button displays the datasets for the marked branch in the sub area of the active main window. CTRL + f7 scrolls down within the dialog window. |
|
CTRL + f8
|
Open sub window. Branches to the active dataset are displayed in a dialog window. The ENTER ↵ button opens the main window for the marked branch in the list view. CTRL + f8 scrolls down within the dialog window. |
Symbols in lists in sub range
In the sub range symbols for the information areas (activities, documents, etc.) are displayed in the lists. Clicking the symbol opens the dataset in detail view.
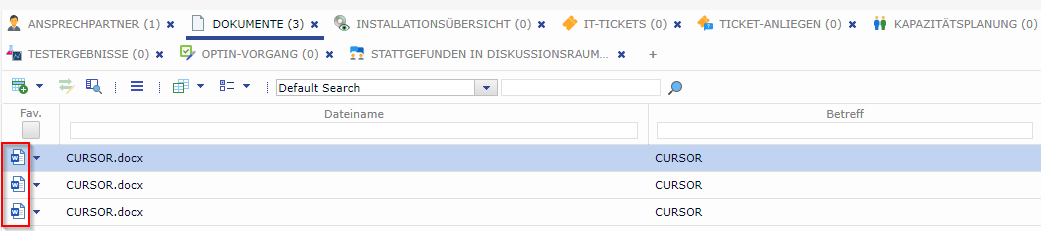
Figure: Exemplary document list in sub range
Filtering and highlighting
Generally, multi-selection in lists is performed with the key combination (<mouse-click>+ SHIFT ⇧ or CTRL key). By default, the filter fields in the table header are hidden. They can be made visible using the filler symbol in the first column using the split button. The permission button can also be accessed using the split button.
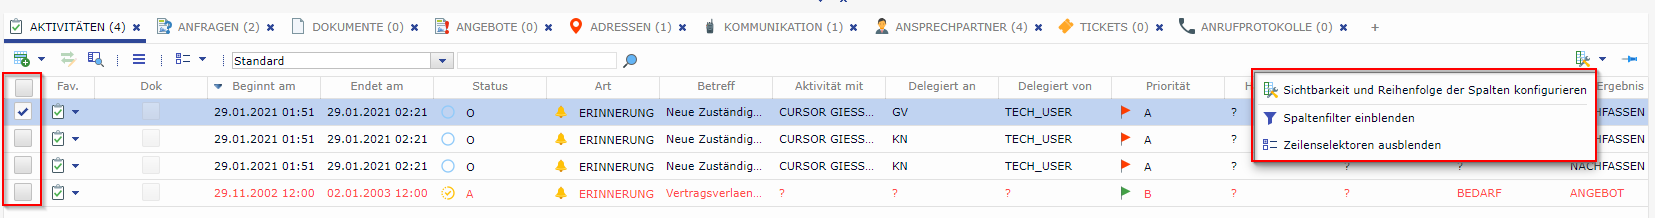
If you activate the checkbox function, a checkbox for multiple highlighting is displayed next to the symbol: It is used for multiple selection:
-
If the checkbox is visible, each click on the box leads to selecting or unselecting the current line.
-
With the tick the line is colored as if being selected with CTRL +<mouse click>. In return, selecting another line with CTRL +<mouse click> automatically leads to the box being checked.
-
The box remains checked until you leave the level.
-
Another checkbox appears above the new column. It serves for global selecting/unselecting of all table datasets.
The ticks in the checkbox are not preserved. They are volatile like any other dataset selection. In the initial state in the session column filters and line selectors are hidden. If you activate these functions, this is valid for all tables within the session.