Type
|
Desktop tile |
|
|---|---|
|
Entity tile |
|
|
BI tile |
|
Description
The info tile "Kanban" displays any datasets with status reference on a Kanban Board. Ideal fields of application for the tile are tickets, sales opportunities or (organizational) activities. The data for the kanban board can come from a search, a sub area or the current work area.
Data visualization according to the Kanban principle
The Kanban board consists of columns, each of which represents one or more combined statuses. On these columns there are cards, where each card corresponds to one dataset. Each card is equipped with the most important information, so that the content of the dataset is immediately apparent. To create more clarity, filter and sort settings are provided to individually design and arrange the Kanban board. The total number of how many datasets are in the columns is displayed right next to the column header. New datasets can be easily created using the "Add dataset" button, without the need for another jump in the CRM system.
Example of a configured tile
Appearance:
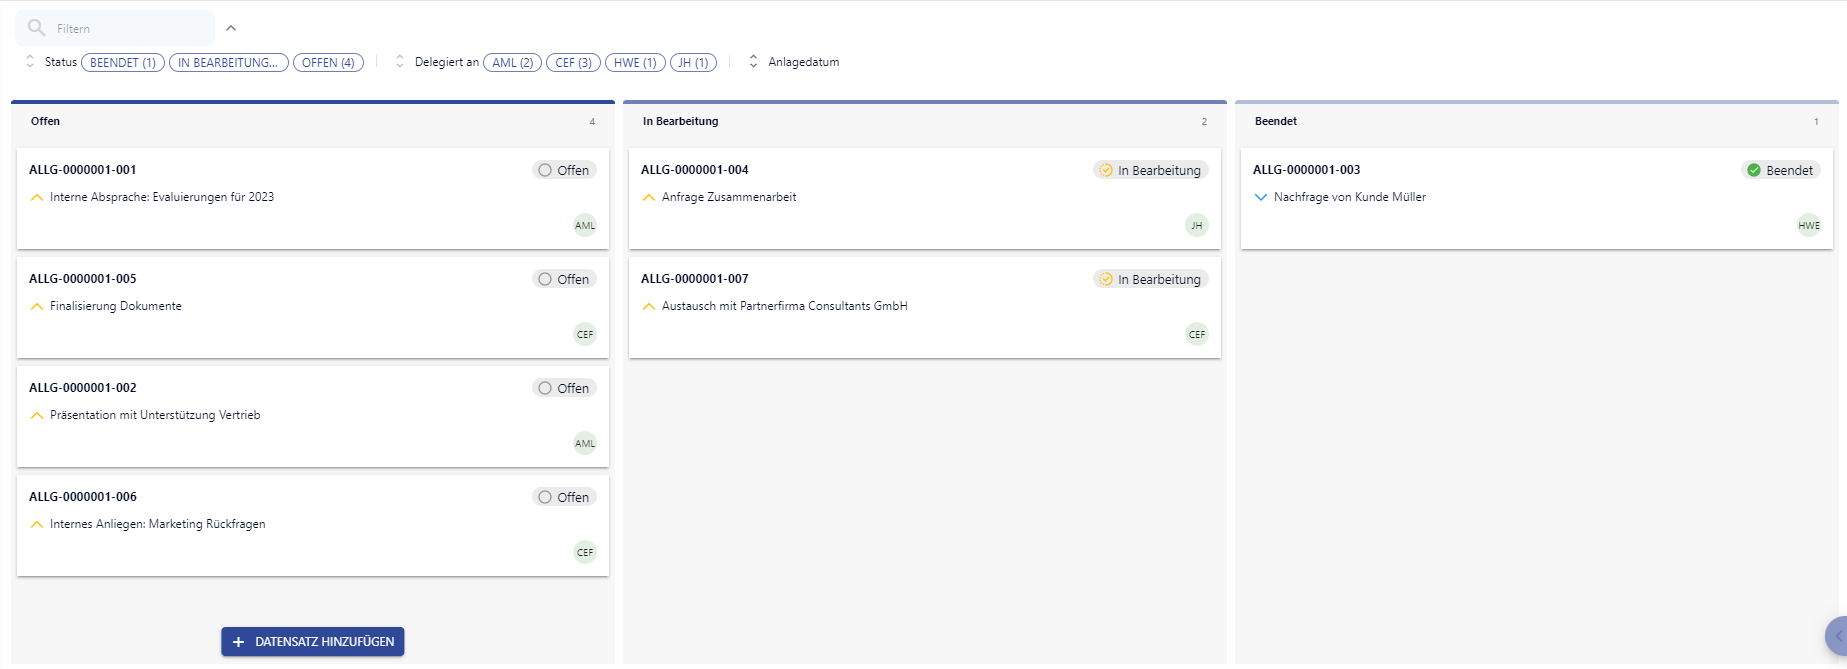
Functionality of the tile
The Kanban tile is a tool with the goal of data visualization for many datasets when they follow a certain procedure.
A typical example can be tickets. These can be grouped and displayed according to their current status and follow a logical order: Open tickets, tickets in progress, and closed tickets.
Assistance for the configuration
The Kanban tile is a powerful tool that enables data visualization of many individual datasets within a predefined workflow. In order for the Kanban display to show its full benefit, many configuration entries are necessary. In order to support the user or admin step-by-step during the configuration, a configuration wizard for the Kanban tile was created, which is automatically executed and displayed within the tile as soon as a new Kanban tile, not yet filled with content, is dragged onto an Infoboard.
Step 1: Area
The area containing the datasets to be displayed can be entered here using a text input and responsive suggestion list.
Step 2: Data source
In this step it is necessary to specify from where the data originates. Available are ...
-
Searches that must be created beforehand
-
the current workspace to be used if the Kanban tile is to be part of a BI board
-
the sub area, which is applied when the Kanban tile is placed on an entity board and should represent datasets from the sub area
If the Kanban tile is configured on a desktop cockpit, a search must be specified and this step is skipped.
Step 3: Search
If a search was selected as the data source in the previous step, the specific search must be entered in this step. The input and the associated suggestion list only allow input of searches that also correspond to the previously entered range.
Step 4: Columns definition
The Kanban tile requires a key field, so that columns can be built on top of it and datasets can be assigned to the columns. A suitable key field can be selected with the help of the suggestion list.
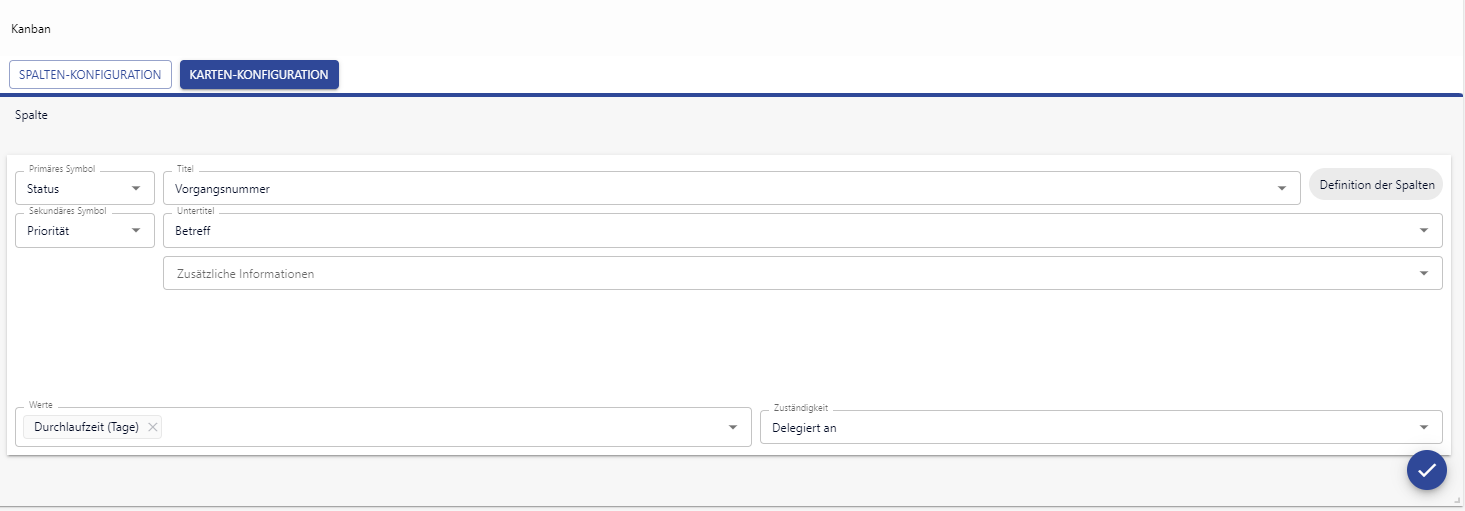
Step 5: Card configuration
A single Kanban card has seven fields, which are all anchored at fixed positions. The information relevant to the data visualization can be placed where the user / admin deems it most useful.
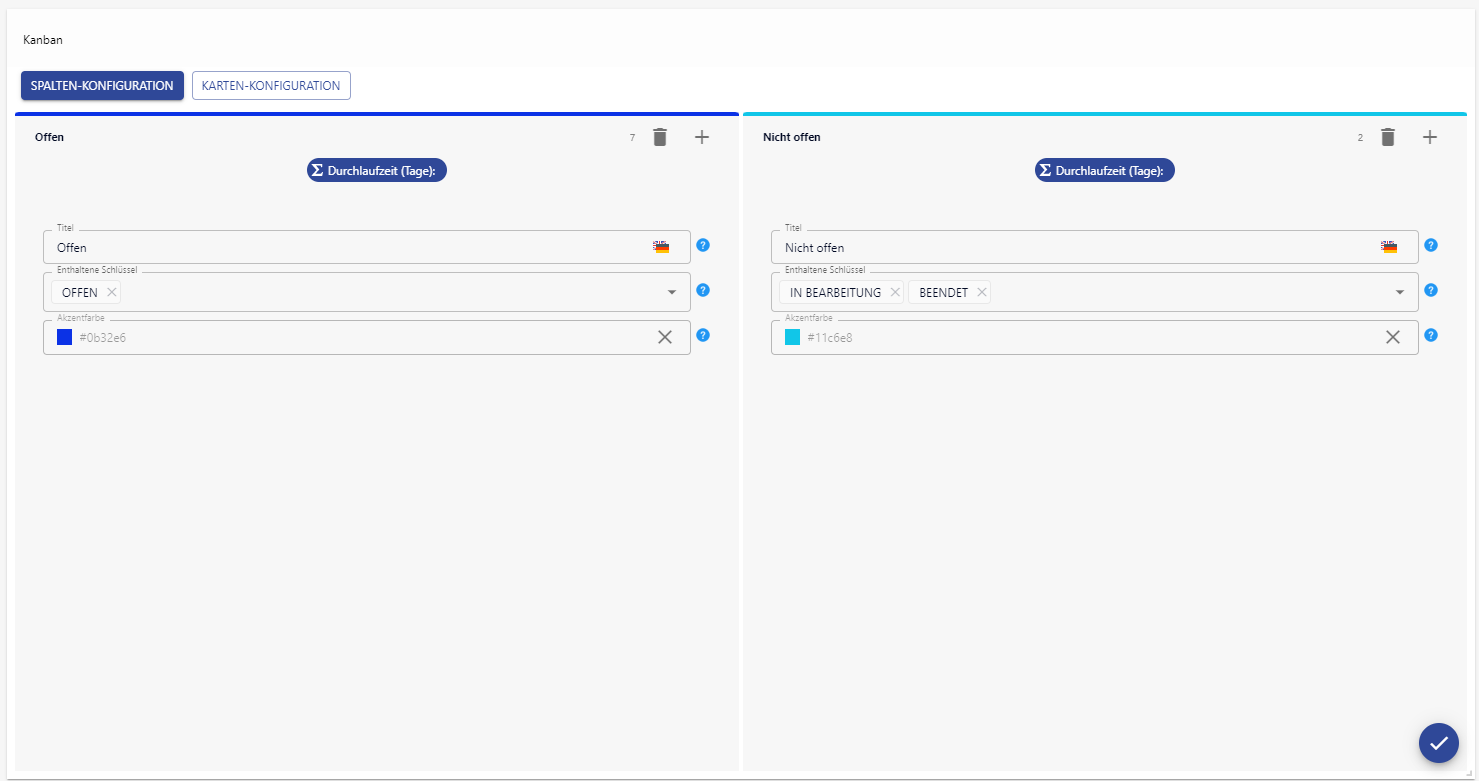
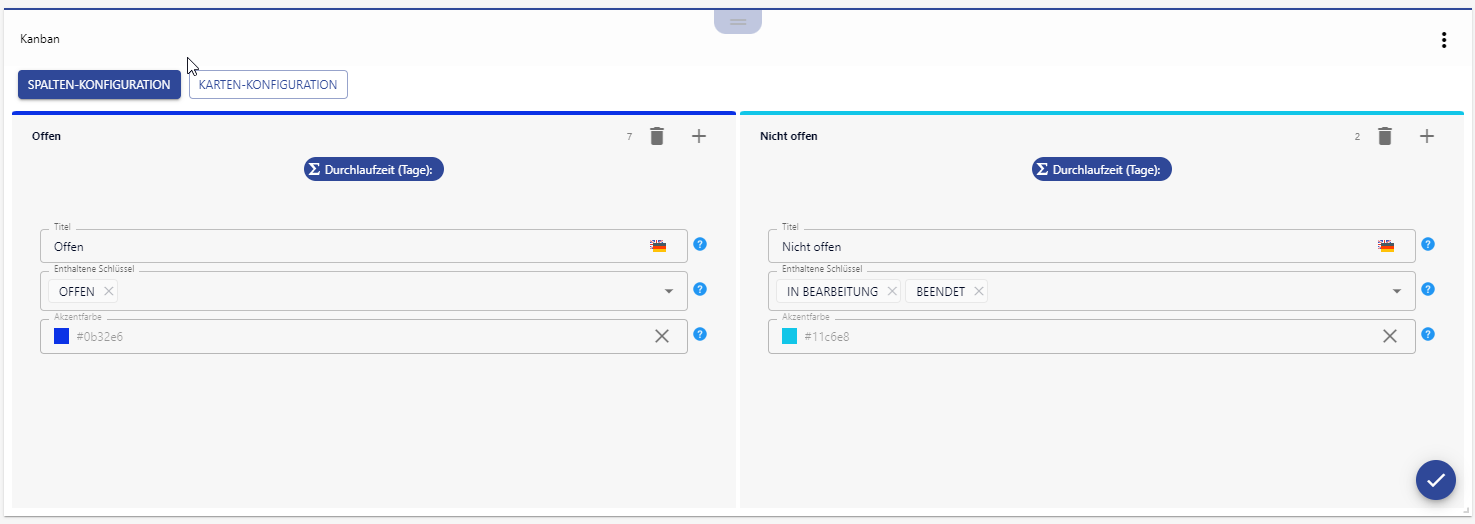
Following the card configuration, the column configuration is shown. A minimum of one column must be specified so that the Kanban tile can display datasets. The title is displayed at the top of a row. Which datasets are assigned to which column depends on the contained keys for the respective columns. Here the values of the key can be specified, which was defined in the fourth step. Additional columns can be added using the Plus button at the top right. Existing columns can be removed with the trashcan icon. Both buttons are located in the upper right corner of a column.
If corrections are necessary, the tile configuration can be accessed as usual via the 3-point menu within the upper right corner or via the pencil symbol in the lower left corner, which displays the columns and card configuration for the current tile instance.
Configuration
The configuration of the tile takes place within the tile configuration menu, which can be accessed via the 3-point menu.
|
Tile configuration |
|
|---|---|
|
General |
|
|
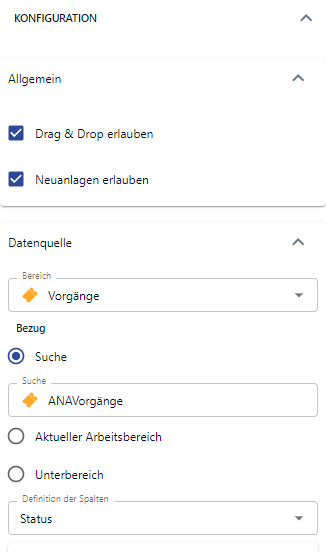
Allow drag & drop |
If activated, individual datasets can be moved to new columns via drag & drop. It should be noted that processes that react to status changes are not triggered by movements via the Kanban tile at the current time. Likewise, status changes can also be enabled via drag & drop, even if they are undesirable and are prevented, for example, on the mask via write protection. It must be checked on a project-specific basis when the use of this functionality does not circumvent standardized workflows. |
|
Allow new entities |
If enabled, a button ("Add dataset") will be presented in the first column at the bottom position, allowing to create a new dataset of the specified entity. If a new creation is performed using this button and the Kanban tile is located on a desktop board, the regular new creation screen of the corresponding entity is called up. If the Kanban tile is on an entity board, the new creation behaves exactly as if the entity's "Add new dataset" button had been clicked in the sub area. |
|
Data source |
|
|
Area |
Here you specify the area / entity that contains the datasets to be visualized using the Kanban method. Practical examples can be projects, activities, tickets or underlying requests. |
|
Search |
One of three possible data sources that can be used for the Kanban tile. Both system and user searches can be stored here. |
|
Current work area |
One of three possible data sources that can be used for the Kanban tile. This setting is used when the tile is used as part of a BI board. |
|
Sub area |
One of three possible data sources that can be used for the Kanban tile. This setting is to be used when datasets from the sub area are displayed and is thus suitable for use on entity boards. |
|
Column configuration |
|
|
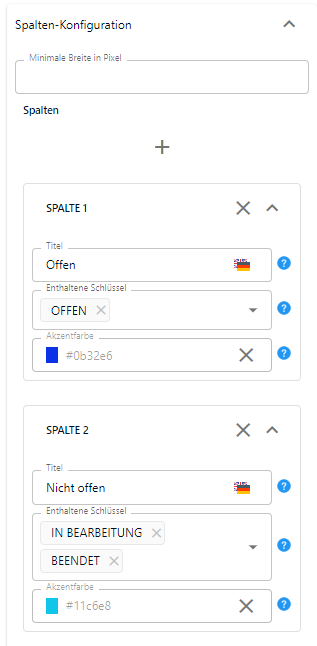
Minimum width in pixels |
A minimum width can be specified here to ensure better visibility of the tile display, especially when it is placed on narrowly drawn infoboards. This is a completely optional setting and does not require any application when placed on large infoboards – for example, desktop cockpits. |
|
Column 1: Title |
The title is displayed in the top position in the corresponding column. Here, a text should be selected for the title that meaningfully represents the statuses behind it – e.g.: Open tickets, Tickets to be processed et cetera. |
|
Column 1: Included keys |
The key fields stored in the fourth step can be assigned to the columns. Multiple mapping is possible here, i.e. one column can map several key statuses. |
|
Column 1: Accent color |
A color can be specified here, which is displayed as the top row of the column. If no color is explicitly specified, the color of the first column is based on the set system color, while other, subsequent columns get a slightly lighter color compared to the column before, so that a color gradient corresponding to the system color is generated without additional configuration. |
|
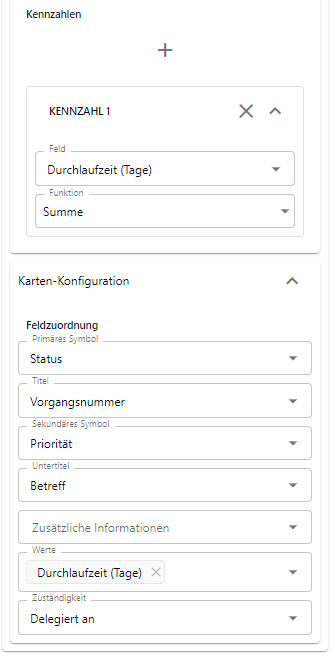
Key figures |
|
|
Field |
Optionally, fields can be defined that represent characteristic values for the datasets. This key figure can be selected in this field – e.g. the total time of tickets. All key figures are displayed above the datasets in the columns according to the set function (see below). |
|
Function |
The function can be used to select whether the sum of the key figures or the average (arithmetic mean) is to be used. |
|
Card configuration |
|
|
Placements of the individual fields |
Each Kanban card is schematically identical and is listed in the configuration wizard to symbolize where which field is located. The exact field positions can be seen in the graphic below: 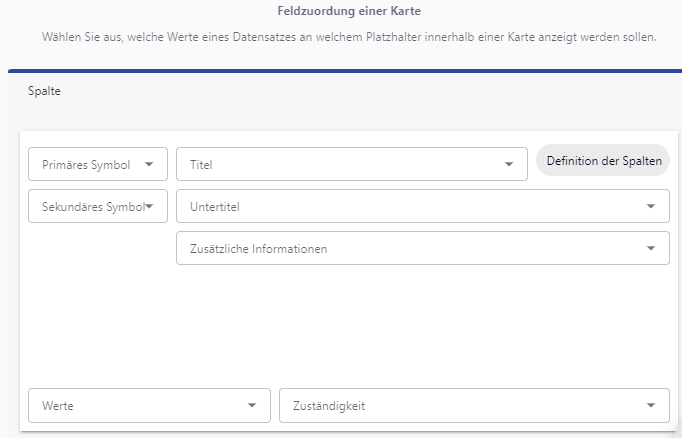
|
|
Primary symbol |
Can be found in the upper left corner of a Kanban card. It is advisable to select key values that have icons for this, as these icons will be used for display. |
|
Title |
Displayed in the center of the top line of a Kanban card. For example, ticket numbers or subjects of quotes can be stored here. |
|
Secondary symbol |
Are displayed below the primary symbol. Just as with the primary symbol, it makes sense to use keys with icons here. |
|
Sub title |
If you are interested in storing further information from dataset fields in the Kanban card, the sub title can display further information. |
|
Additional information |
If further field information is to be displayed in addition to the title and sub title, this field offers the third possibility to store information from datasets. |
|
Values |
Characteristic numerical values such as total times, effort, etc. can be stored in the lower left corner using this setting. |
|
Responsibility |
Information that refers to employees or contact persons, for example, can be stored here so that this information is displayed in the lower right corner. |
Example of a configuration
FAQs