
Description
Explorative data analysis
With the Pivot tile you get an easy start into the explorative data analysis with CURSOR-CRM.
Benefits
You gain new insights into your data and generate new information that you need for your business - without complicated database queries or manual reports. The tile can be operated by any user with a few mouse clicks, so that everyone can quickly gain insight into their data and current business situations as soon as they need it. The tile is therefore ideal for your sales, marketing or customer service. As infoboard administrator, you can also specify any system boards with pre-selected Pivots to share important insights with your department, for example, without reconfiguration.
The following example in the table below analyzes the relationship between customer industry and the prospects of success of inquiries (opportunities) of a fictitious company, measured by the average offer value. The table shows that the example company shown here not only has particularly good prospects of success in the IT sector (the largest volume of offers was actually successful), but also achieved the highest turnovers there. In contrast, quotes to companies from the services segment failed disproportionately often, even though the actual earnings volume was still high.
From this report, measures can now be derived for the business, especially with customers from the service sector.
Details
The tile displays your data in a flexible table layout, whereby various heatmap and chart displays are also possible as alternatives. You can select any data sources from your CRM - in quick access to your BI boards or flexibly from different data areas via search. On the tile, simply drag and drop the fields or attributes you want to analyze and compare, and distribute them across rows and columns to group or contrast them.
You can then filter by attribute and choose from various aggregate functions to analyze using their numeric field values.
Available on
Desktop Entity Workspace/BI
Layout
The document preview can display various file types in different modes. You can switch between the modes using the toolbar buttons or by changing the selection set, whereby the changes are persisted via the toolbar.
Operating the pivot tile
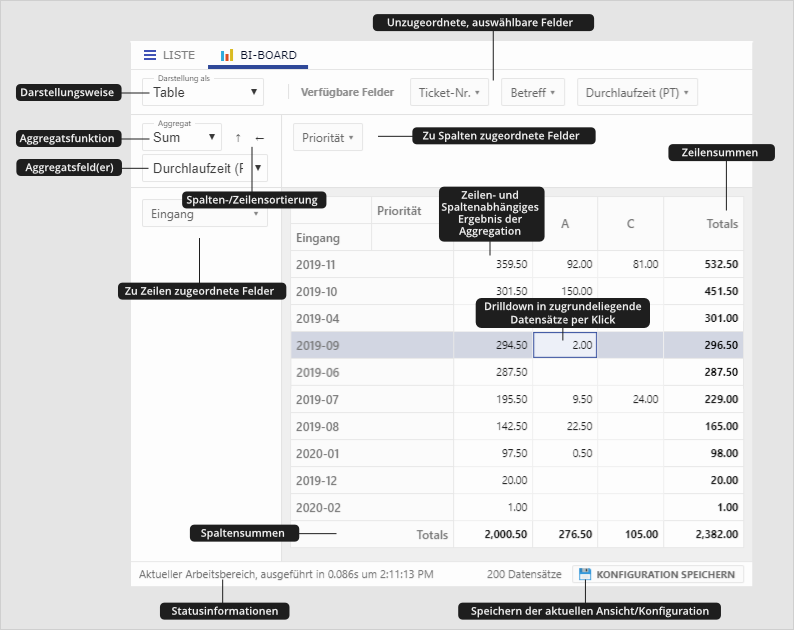
To perform an exploratory data analysis with the Pivot tile, first consider the scenario you want to analyze. Place the tile on a BI board of the entity to be analyzed or, if the analysis domain includes more than one entity or has certain constraints, construct a search in the CRM, which has the attribute fields to be analysed as output/list fields, and enter it on the tile on a desktop board. If you have started a Pivot session via the tile, all fields available in the workspace or search result are available to you. Simply select the appropriate data source in the tile's configuration view.
If you want to save your Pivot analysis, note that the analyzed fields must exist in the work area/search result. You ensure this by using the search construction or by maintaining the corresponding field properties.
Use Drag'n'Drop to drag the fields that are relevant for your analysis context to the areas for rows and columns. The order of insertion is relevant for the clustering/grouping within the display and can be adjusted subsequently. The Pivot view updates itself live and automatically. The cell values are aggregated over the number of datasets that correspond to the column and row values. In the standard system, the one dataset number is displayed. A cell therefore represents all datasets that have the value(s) from the column and row of the cell in the respective fields. Apart from the number, you can choose from a variety of aggregates and statistical functions. These are applied to the datasets that meet the column and row conditions of a cell. This provides you with fine-granular evaluations to analyze historical or current conditions that you have mapped in your CRM or to build and argue your business story.
You can also simply click on a cell to jump to the underlying datasets. The last row or column displays the corresponding column or row total, while the last cell at the bottom right displays the total sum.
In addition to the pure tabular layout, you can choose from a variety of other layouts from the corresponding drop-down menu, including visual extensions of the tabular layout such as heat maps or bar charts per cell to make the results more quickly detectable, but also completely different layouts such as pie charts or scatter charts.
Advanced configuration
Tile configuration parameters
Data source
Desktop board
|
Search |
Selected The data to be visualized is determined by a search. |
|---|---|
|
Name of search |
The name of the search of the data to be visualized in case of search. |
Entity Board
|
Search |
Selected The data to be visualized is determined by a search. |
|---|---|
|
Name of search |
The name of the search of the data to be visualized in case of search. |
|
Related data/sub area |
Selected The data to be visualised are determined from a relation (the sub area of the currently opened dataset). |
|
Relation name |
|
Workspace/BI board
|
Current work area |
Selected The data to be visualized is determined from the current work area ((search result) list). |
|---|---|
|
Search |
Selected The data to be visualized is determined by a search. |
|
Name of search |
The name of the search of the data to be visualized in case of search. |
Preselections
In this configuration group, the (pre-)allocations of the values relevant for the evaluation are recorded. The details of these values can be found under Operating the Pivot.
The tile currently only supports the languages German (de) and English (en). When configuring pre-allocations, the names of the options can be used in the respective user language. If the user language is different from German and English, the English terms are used.
The tile can be provided in other languages on request.
|
Columns |
The (technical) names of the fields as pre-allocation for the column selection. The order of the columns is relevant for the layout. |
|---|---|
|
Rows |
The (technical) names of the fields as pre-allocation for the row selection. The order of the rows is relevant for the layout. |
|
Aggregate fields |
The (technical) names of the fields (0 - 2 fields) over which the aggregator should aggregate. |
|
Renderer |
The name of the renderer, i.e. the representation of the Pivot. The available renderers correspond to the selection options in the Display as field of the Pivot user interface. |
|
Aggregator |
Name of the aggregator that aggregates using the aggregate fields. The result is displayed in the cells of the Pivot table. The available aggregators correspond to the selection options in the Aggregate field of the Pivot user interface. |
Interactive mode
|
Show control elements |
Activated Around the Pivot table, a user interface with control elements for configuring the table is displayed. The table can be edited live by the user. 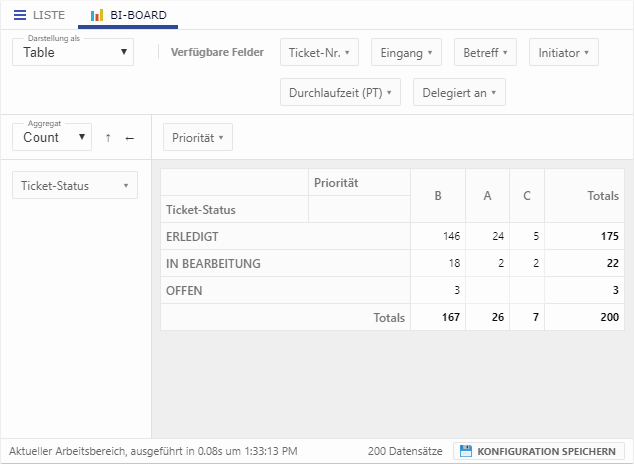
Deactivated No control elements are displayed. The displayed Pivot cannot be edited. 
|
|---|---|
|
Allow to save changes |
Provided that Show control elements is activated, the user can save his set Pivot configuration via the user interface. The following button is displayed as soon as a change that can be saved has been made: |
|
Position of the field selection |
Top The assignable fields/the field selection is displayed above the Pivot table. 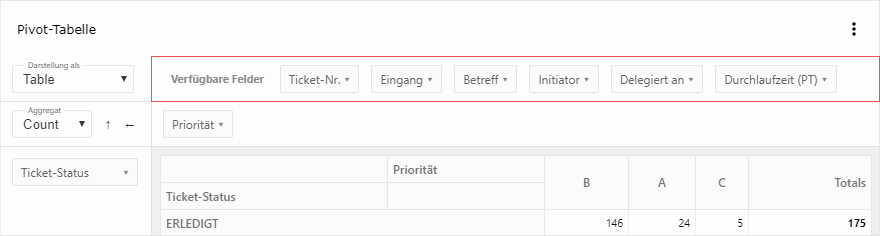
Left The assignable fields/the field selection is displayed to the left of the Pivot table. 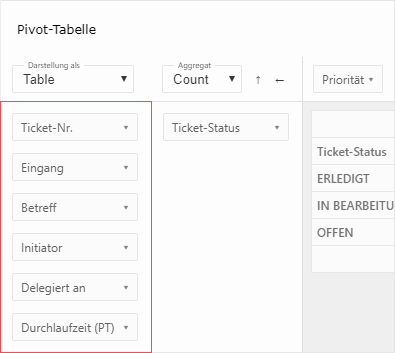
|

Layout
|
Show status bar |
Activated A status bar is displayed, which shows status and meta information about the Pivot. This includes the data source, runtime information (duration and time of the search execution) and the number of datasets. 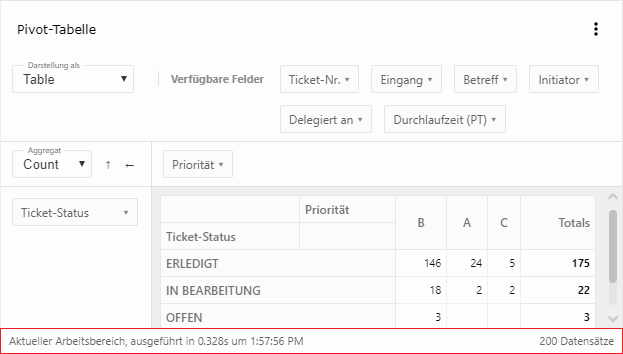
|
|---|---|
|
Show data source in tile sub title |
Activated The name of the data source (search, relation or the current workspace) is visualized in the sub title of the tile. 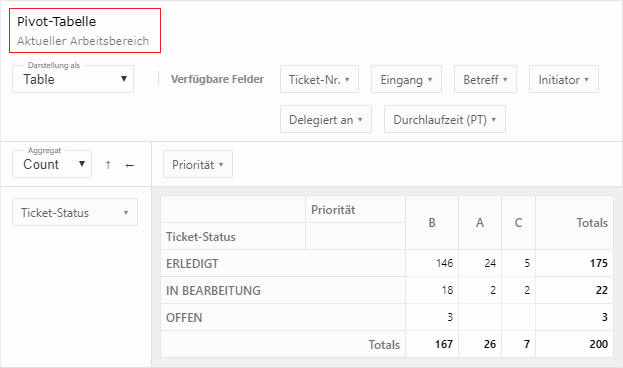
|
Aggregate date values by...
|
Day |
Selected Date and time values are summarized and displayed to the exact day. Time information is ignored in the display and calculation. |
|---|---|
|
Month |
Selected Date and time values are summarized and displayed to the exact month. Day information is ignored in the display and calculation. |
|
Year |
Selected Date and time values are summarized and displayed to the exact year. Daily information and monthly information are ignored in the display and calculation. |
Format lookup values as...
|
Key |
Selected Lookup values are displayed using their key. |
|---|---|
|
Description |
Selected Lookup values are displayed via their descriptive text. If this option is selected, it must be taken into account that this means that numerical lookup values can no longer be aggregated. This may mean that the values displayed can no longer be sorted in a meaningful way, especially in the case of numerical lookup keys. |
|
Key + Description |
Selected Lookup fields are output in syntax If this option is selected, it must be taken into account that this means that numerical lookup values can no longer be aggregated. |