Type
|
Desktop tile |
|
|---|---|
|
Entity tile |
|
Description
The "System monitor" info tile is intended for system administrators. It shows the current system status.
Layout
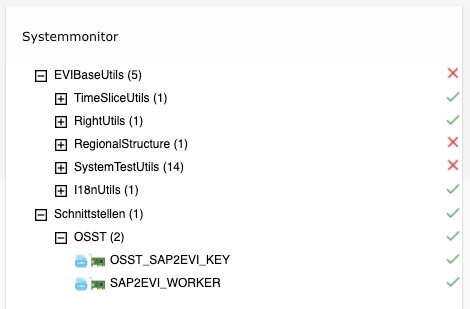
The system monitor is available in two views. In the interactive tree view, the user can expand or collapse the nodes and call up further information on the node by clicking on the icon.
![]()
Via the icon
![]()
the corresponding dataset of the Interface overview entity opens. The icons on the right side of the tile show the status of a node. The status is determined from the corresponding dataset as follows:
-
The field "current status" is evaluated. In status Error the node also goes to status Error
-
The system checks whether the field "technical information" is empty. In this case, this is stored as a warning at the node.
-
If the field is filled, the system checks whether errors are contained. The node now goes to the status Error
-
If the field contains warnings, the node goes to the status Warning.
-
Otherwise the node is displayed in green.
-
-
The runtime and the execution interval of an interface are checked as follows:
-
Runtime: The field "Maximum runtime" specifies the maximum runtime of the interface in minutes. The system now checks whether the runtime has been exceeded using the "Start time" and "End time" fields. In this case, the node goes to the status Error
-
Interval: The "Interval" field specifies the execution interval in minutes. If the interface did not run within this interval, the node goes to the status Error
-
All configured InterfaceOver datasets are loaded and then the "Last interface run" (InterfaceDetail) is evaluated there.
Configuration
Search
|
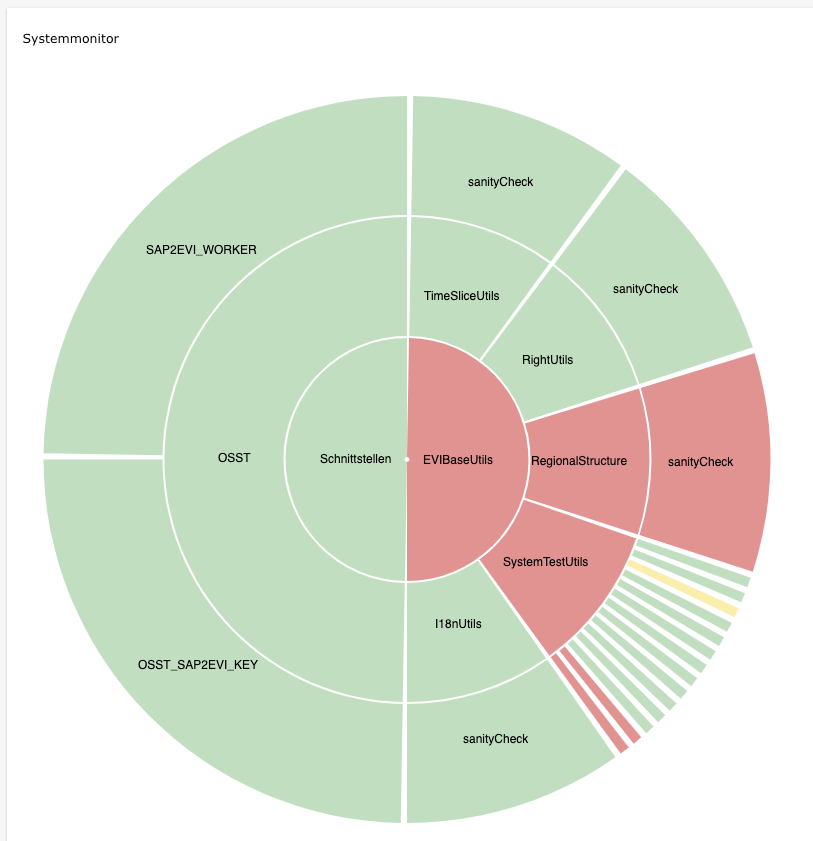
Use Donut Chart |
This parameter specifies whether the donut view is to be used |
|---|---|
|
Configuration |
The data to be displayed is entered in this parameter. Hereby the following syntax must be noted: Groovy
Display names The configuration contains groups as the topmost element. Each group has an arbitrary display name in the "name" field and can contain subordinated elements. These are again listed in the "leafs" field. If a group contains no subordinated elements, no "leafs" field may be listed. A subordinated element can itself be a group. A subordinated element that is not a group has an individual display name "name" and an ID "id" of the associated interface dataset. Information such as the status of the interface is determined from this dataset. |